

Accelerometer profiles of physical activity and inactivity in normal weight, overweight, and obese U.S. men and women
- PMID: 20682057
- PMCID: PMC2924256
- DOI: 10.1186/1479-5868-7-60
Accelerometer profiles of physical activity and inactivity in normal weight, overweight, and obese U.S. men and women
Abstract
Background: The 2005-2006 National Health and Nutrition Examination Survey (NHANES) is used to describe an accelerometer-derived physical activity/inactivity profile in normal weight (BMI < 25 kg/m2), overweight (25 </= BMI < 30 kg/m2), and obese (BMI >/= 30 kg/m2) U.S. adults.
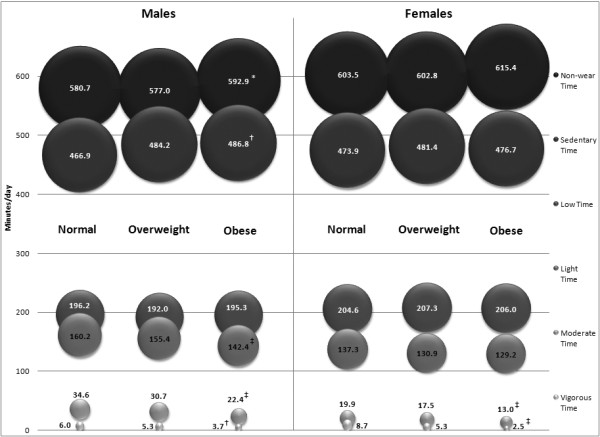
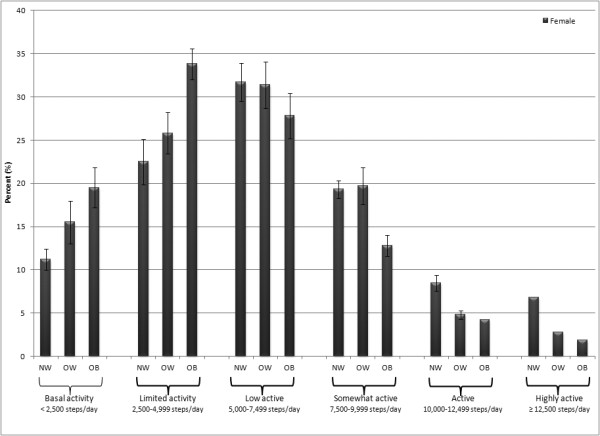
Methods: We computed physical activity volume indicators (activity counts/day, uncensored and censored steps/day), rate indicators (e.g., steps/minute), time indicators (employing NHANES activity counts/minute cut points to infer time in non-wear, sedentary, low, light, moderate, and vigorous intensities), the number of breaks in sedentary time (occasions when activity counts rose from < 100 activity/counts in one minute to >/= 100 activity counts in the subsequent minute), achievement of public health guidelines, and classification by step-defined physical activity levels. Data were examined for evidence of consistent and significant gradients across BMI-defined categories.
Results: In 2005-2006, U.S adults averaged 6,564 +/- SE 107 censored steps/day, and after considering non-wear time, they spent approximately 56.8% of the rest of the waking day in sedentary time, 23.7% in low intensity, 16.7% in light intensity, 2.6% in moderate intensity, and 0.2% in vigorous intensity. Overall, approximately 3.2% of U.S. adults achieved public health guidelines. The normal weight category took 7,190 +/- SE 157 steps/day, and spent 25.7 +/- 0.9 minutes/day in moderate intensity and 7.3 +/- 0.4 minutes/day in vigorous intensity physical activity. The corresponding numbers for the overweight category were 6,879 +/- 140 steps/day, 25.3 +/- 0.9 minutes/day, and 5.3 +/- 0.5 minutes/day and for the obese category 5,784 +/- 124 steps/day, 17.3 +/- 0.7 minutes/day and 3.2 +/- 0.4 minutes/day. Across BMI categories, increasing gradients and significant trends were apparent in males for sedentary time and decreasing gradients and significant trends were evident in time spent in light intensity, moderate intensity, and vigorous intensity. For females, there were only consistent gradients and significant trends apparent for decreasing amounts of time spent in moderate and vigorous intensity.
Conclusions: Simple indicators of physical activity volume (i.e., steps/day) and time in light, moderate or vigorous intensity physical activity differ across BMI categories for both sexes, suggesting that these should continue to be targets for surveillance.
Figures


References
-
- Ogden CL, Carroll MD, McDowell MA, Flegal KM. Obesity among adults in the United States--no statistically significant chance since 2003-2004. NCHS Data Brief. 2007. pp. 1–8. - PubMed
-
- Centers for Disease Control (CDC) Physical activity trends--United States, 1990-1998. Morb Mortal Wkly Rep. 2001;50:166–169. - PubMed
-
- Centers for Disease Control (CDC) Prevalence of regular physical activity among adults--United States, 2001 and 2005. Morb Mortal Wkly Rep. 2007;56:1209–1212. - PubMed
-
- McCrory MA, Suen VM, Roberts SB. Biobehavioral influences on energy intake and adult weight gain. J Nutr. 2002;132:3830S–3834S. - PubMed
LinkOut - more resources
Full Text Sources
Medical
