. 2010 Aug 4;99(3):745-54.
doi: 10.1016/j.bpj.2010.05.028.

Distribution of electromechanical delay in the heart: insights from a three-dimensional electromechanical model

Affiliations

Distribution of electromechanical delay in the heart: insights from a three-dimensional electromechanical model

V Gurev et al. Biophys J. .

Abstract

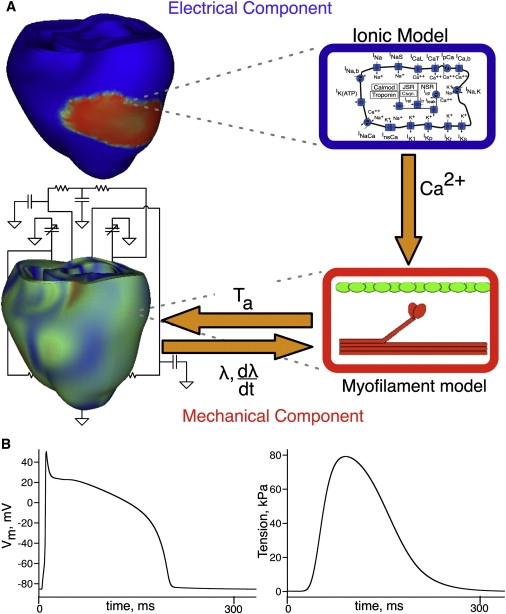
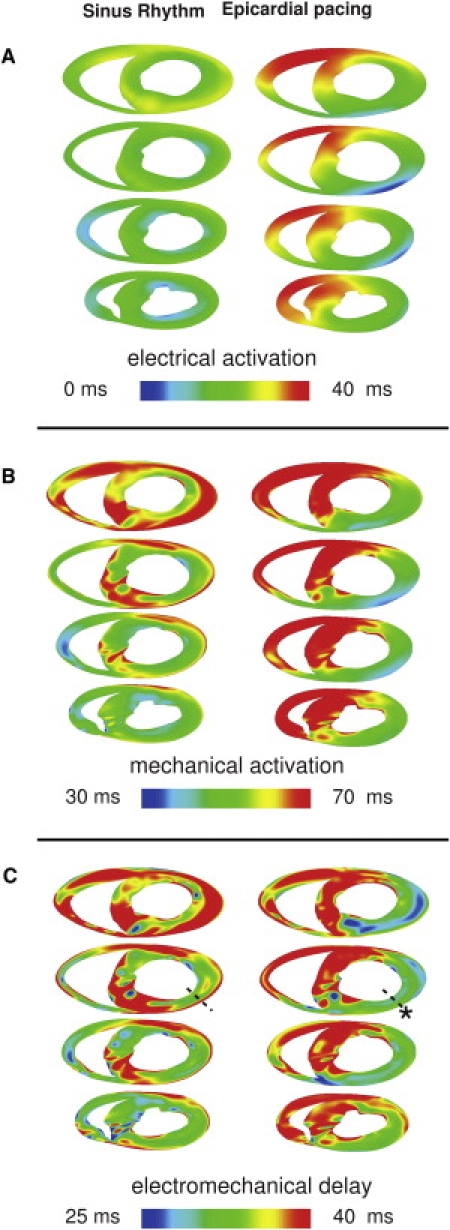
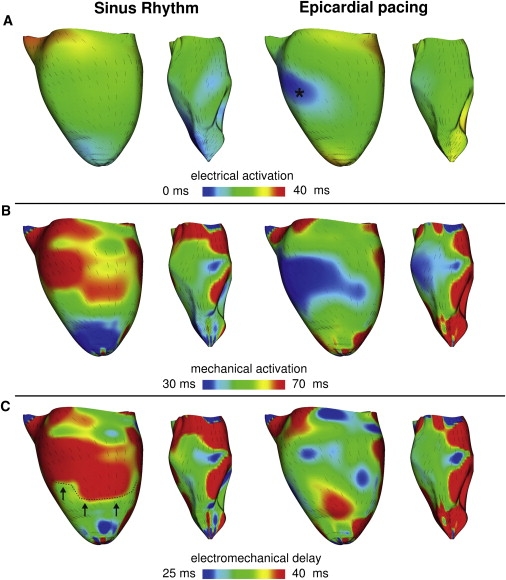
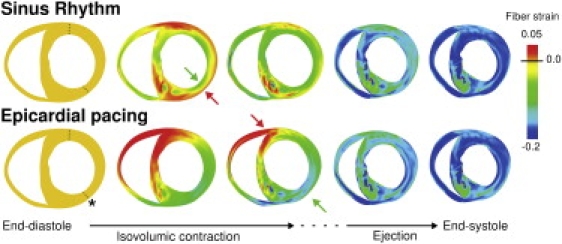
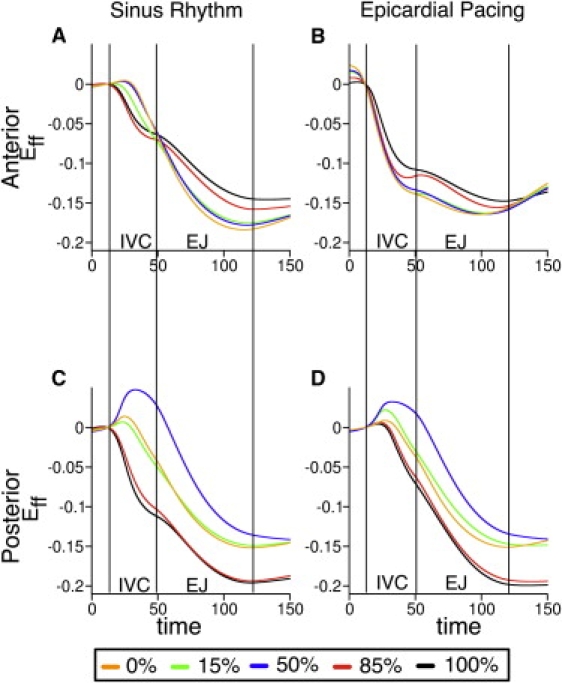
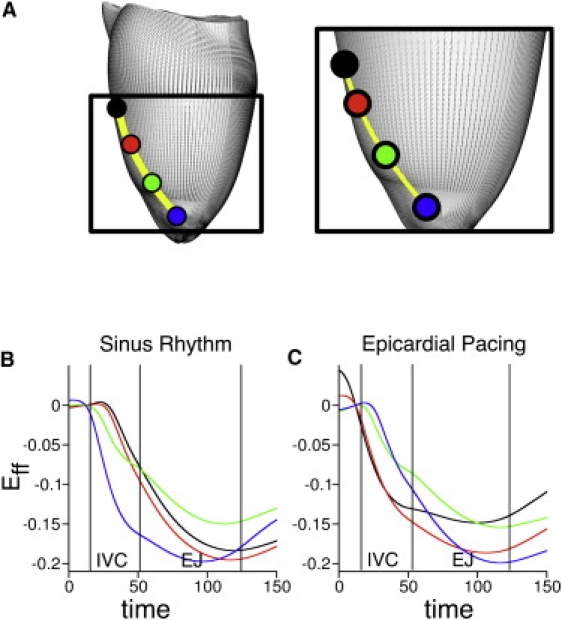
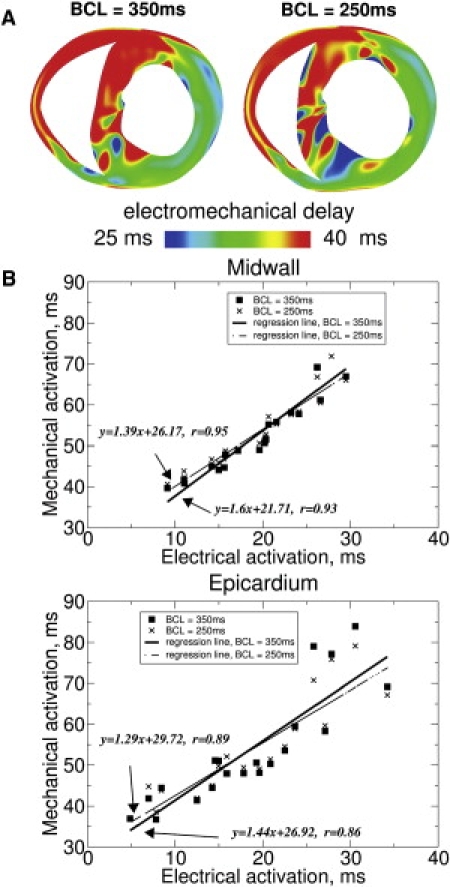
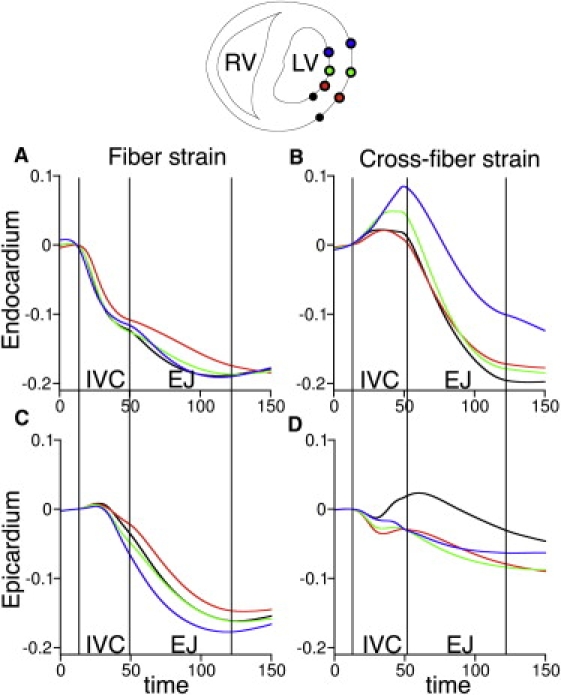
In the intact heart, the distribution of electromechanical delay (EMD), the time interval between local depolarization and myocyte shortening onset, depends on the loading conditions. The distribution of EMD throughout the heart remains, however, unknown because current experimental techniques are unable to evaluate three-dimensional cardiac electromechanical behavior. The goal of this study was to determine the three-dimensional EMD distributions in the intact ventricles for sinus rhythm (SR) and epicardial pacing (EP) by using a new, to our knowledge, electromechanical model of the rabbit ventricles that incorporates a biophysical representation of myofilament dynamics. Furthermore, we aimed to ascertain the mechanisms that underlie the specific three-dimensional EMD distributions. The results revealed that under both conditions, the three-dimensional EMD distribution is nonuniform. During SR, EMD is longer at the epicardium than at the endocardium, and is greater near the base than at the apex. After EP, the three-dimensional EMD distribution is markedly different; it also changes with the pacing rate. For both SR and EP, late-depolarized regions were characterized with significant myofiber prestretch caused by the contraction of the early-depolarized regions. This prestretch delays myofiber-shortening onset, and results in a longer EMD, giving rise to heterogeneous three-dimensional EMD distributions.


Figures

Figure 1
Figure 1
(A) Schematic diagram of the electromechanical model. (B) Traces of transmembrane potential (left) and active tension (right) in the model.
Figure 2
Figure 2
Electrical activation (A), mechanical activation (B), and EMD (C) maps for SR and EP at different short-axis cross-sections of the ventricles. The asterisk marks the pacing location. (Dashed line) Transmural direction from the pacing site. (Bottom of images) Anterior wall.
Figure 3
Figure 3
Electrical activation times (A), mechanical activation times (B), and EMD (C) during SR and EP. Each panel presents LV lateral view of epicardium (left) and endocardium (right). (Lines) Fiber direction.
Figure 4
Figure 4
Transmural maps of strain in the fiber direction during the systolic phase of the cardiac cycle for SR and EP. This transmural view corresponds to the second short-axis view in Fig. 2. (Arrows) Early shortening and prestretching of myocardium during the isovolumic phase. (Asterisk) Pacing site. (Dashed lines) Transmural locations along which fiber strain was analyzed.
Figure 5
Figure 5
Temporal traces of fiber strain along the dashed lines in Fig. 4 (anterior and posterior walls) at different wall depths (expressed as % of wall thickness) during SR and after EP. Epicardium and endocardium correspond to 0% and 100% wall depth, respectively. IVC, isovolumic phase; EJ, ejection phase.
Figure 6
Figure 6
Temporal traces of epicardial fiber strain at four locations along the fiber direction. (A) Locations range from the site marked by an asterisk in Figs. 3–5 (black dot) to the apex (blue dot). Traces of strain for SR (B) and EP (C). The color of each trace denotes the location in panel A. Abbreviations as in Fig. 5.
Figure 7
Figure 7
Transmural EMD maps (A) after EP at BCL = 350 ms (left) and BCL = 250 ms (right). The transmural map for BCL = 350 ms is the same as the second slice in Fig. 2C (left), and is included here for comparison. Regressional analysis of mechanical versus electrical activation times (B) at the midwall (top) and at the epicardium (bottom) of LV free wall. (Squares and crosses) Data points for BCL = 350 ms and BCL = 250 ms, respectively. (Solid and dashed lines) Regression lines for BCL = 350 ms and BCL = 250 ms, respectively.
Figure 8
Figure 8
Strain in the fiber (left) and cross-fiber direction (right) at the endocardium (A) and epicardium (B) during SR. Colors correspond to the location where strain was measured; the latter are shown in the transmural view of the ventricles above the graphs. Abbreviations as in Fig. 5.

Similar articles

Cited by

References

    1. Prinzen F.W., Augustijn C.H., Reneman R.S. The time sequence of electrical and mechanical activation during spontaneous beating and ectopic stimulation. Eur. Heart J. 1992;13:535–543. - PubMed
    1. Badke F.R., Boinay P., Covell J.W. Effects of ventricular pacing on regional left ventricular performance in the dog. Am. J. Physiol. 1980;238:H858–H867. - PubMed
    1. Ashikaga H., Coppola B.A., Omens J.H. Transmural dispersion of myofiber mechanics: implications for electrical heterogeneity in vivo. J. Am. Coll. Cardiol. 2007;49:909–916. - PMC - PubMed
    1. Ashikaga H., Omens J.H., Covell J.W. Transmural mechanics at left ventricular epicardial pacing site. Am. J. Physiol. Heart Circ. Physiol. 2004;286:H2401–H2407. - PMC - PubMed
    1. Vetter F.J., McCulloch A.D. Three-dimensional analysis of regional cardiac function: a model of rabbit ventricular anatomy. Prog. Biophys. Mol. Biol. 1998;69:157–183. - PubMed

Publication types