

Attractive protein-polymer interactions markedly alter the effect of macromolecular crowding on protein association equilibria
- PMID: 20682270
- PMCID: PMC2913179
- DOI: 10.1016/j.bpj.2010.05.013
Attractive protein-polymer interactions markedly alter the effect of macromolecular crowding on protein association equilibria
Erratum in
- Biophys J. 2011 Jan 5;100(1):269
Abstract
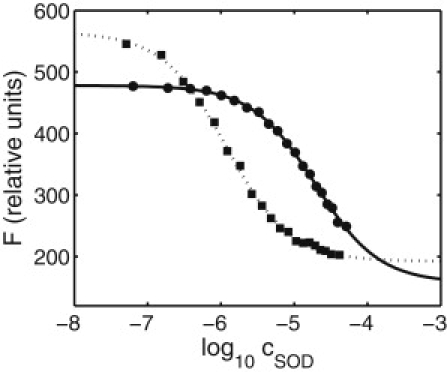
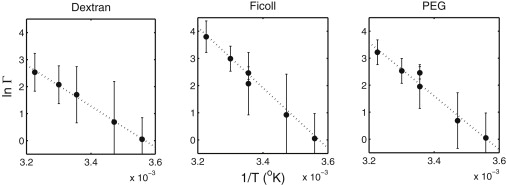
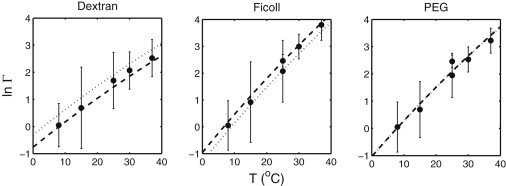
The dependence of the fluorescence of catalase upon the concentration of added superoxide dismutase (SOD) indicates that SOD binds to saturable sites on catalase. The affinity of SOD for these sites varies with temperature, and with the concentration of each of three nominally inert polymeric additives--dextran 70, Ficoll 70, and polyethylene glycol 2000. At room temperature (25.0 degrees C) and higher, the addition of high concentrations of polymer is found to significantly enhance the affinity of SOD for catalase, but with decreasing temperature the enhancing effect of polymer addition diminishes, and at 8.0 degrees C, addition of polymer has little or no effect on the affinity of SOD for catalase. The results presented here provide the first experimental evidence for the existence of competition between a repulsive excluded volume interaction between protein and polymer, which tends to enhance association of dilute protein, and an attractive interaction between protein and polymer, which tends to inhibit protein association. The net effect of high concentrations of polymer upon protein associations depends upon the relative strength of these two types of interactions at the temperature of measurement, and may vary significantly between different proteins and/or polymers.
2010 Biophysical Society. Published by Elsevier Inc. All rights reserved.
Figures

References
-
- Schreiber G. Kinetic studies of protein-protein interactions. Curr. Opin. Struct. Biol. 2002;12:41–47. - PubMed
-
- Stites W.E. Protein-protein interactions: interface structure, binding thermodynamics, and mutational analysis. Chem. Rev. 1997;97:1233–1250. - PubMed
-
- Zimmerman S.B., Minton A.P. Macromolecular crowding: biochemical, biophysical, and physiological consequences. Annu. Rev. Biophys. Biomol. Struct. 1993;22:27–65. - PubMed
-
- Fulton A.B. How crowded is the cytoplasm? Cell. 1982;30:345–347. - PubMed
-
- Ellis R.J. Macromolecular crowding: obvious but underappreciated. Trends Biochem. Sci. 2001;26:597–604. - PubMed
Publication types
MeSH terms
Substances
Grants and funding
LinkOut - more resources
Full Text Sources
Other Literature Sources
