

Quantitative imaging of human red blood cells infected with Plasmodium falciparum
- PMID: 20682274
- PMCID: PMC2913174
- DOI: 10.1016/j.bpj.2010.04.065
Quantitative imaging of human red blood cells infected with Plasmodium falciparum
Abstract
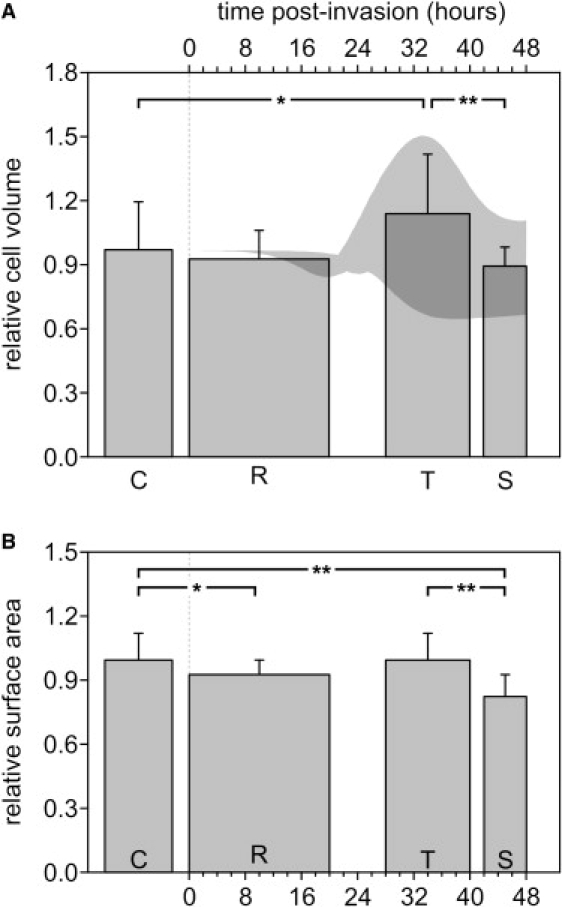
During its 48 h asexual reproduction cycle, the malaria parasite Plasmodium falciparum ingests and digests hemoglobin in excess of its metabolic requirements and causes major changes in the homeostasis of the host red blood cell (RBC). A numerical model suggested that this puzzling excess consumption of hemoglobin is necessary for the parasite to reduce the colloidosmotic pressure within the host RBC, thus preventing lysis before completion of its reproduction cycle. However, the validity of the colloidosmotic hypothesis appeared to be compromised by initial conflicts between model volume predictions and experimental observations. Here, we investigated volume and membrane area changes in infected RBCs (IRBCs) using fluorescence confocal microscopy on calcein-loaded RBCs. Substantial effort was devoted to developing and testing a new threshold-independent algorithm for the precise estimation of cell volumes and surface areas to overcome the shortfalls of traditional methods. We confirm that the volume of IRBCs remains almost constant during parasite maturation, suggesting that the reported increase in IRBCs' osmotic fragility results from a reduction in surface area and increased lytic propensity on volume expansion. These results support the general validity of the colloidosmotic hypothesis, settle the IRBC volume debate, and help to constrain the range of parameter values in the numerical model.
2010 Biophysical Society. Published by Elsevier Inc. All rights reserved.
Figures
Similar articles
-
FRET imaging of hemoglobin concentration in Plasmodium falciparum-infected red cells.PLoS One. 2008;3(11):e3780. doi: 10.1371/journal.pone.0003780. Epub 2008 Nov 21. PLoS One. 2008. PMID: 19023444 Free PMC article.
-
Surface area loss and increased sphericity account for the splenic entrapment of subpopulations of Plasmodium falciparum ring-infected erythrocytes.PLoS One. 2013;8(3):e60150. doi: 10.1371/journal.pone.0060150. Epub 2013 Mar 28. PLoS One. 2013. PMID: 23555907 Free PMC article.
-
The homeostasis of Plasmodium falciparum-infected red blood cells.PLoS Comput Biol. 2009 Apr;5(4):e1000339. doi: 10.1371/journal.pcbi.1000339. Epub 2009 Apr 3. PLoS Comput Biol. 2009. PMID: 19343220 Free PMC article.
-
Cellular architecture of Plasmodium falciparum-infected erythrocytes.Int J Parasitol. 2010 Aug 15;40(10):1127-35. doi: 10.1016/j.ijpara.2010.04.012. Epub 2010 May 15. Int J Parasitol. 2010. PMID: 20478310 Review.
-
Vesicle-mediated trafficking of parasite proteins to the host cell cytosol and erythrocyte surface membrane in Plasmodium falciparum infected erythrocytes.Int J Parasitol. 2001 Oct;31(12):1381-91. doi: 10.1016/s0020-7519(01)00256-9. Int J Parasitol. 2001. PMID: 11566305 Review.
Cited by
-
Quantitation of malaria parasite-erythrocyte cell-cell interactions using optical tweezers.Biophys J. 2014 Aug 19;107(4):846-53. doi: 10.1016/j.bpj.2014.07.010. Biophys J. 2014. PMID: 25140419 Free PMC article.
-
Rolling Adhesion of Schizont Stage Malaria-Infected Red Blood Cells in Shear Flow.Biophys J. 2017 May 9;112(9):1908-1919. doi: 10.1016/j.bpj.2017.04.001. Biophys J. 2017. PMID: 28494961 Free PMC article.
-
Plasmodium falciparum and TNF-α Differentially Regulate Inflammatory and Barrier Integrity Pathways in Human Brain Endothelial Cells.mBio. 2022 Oct 26;13(5):e0174622. doi: 10.1128/mbio.01746-22. Epub 2022 Aug 29. mBio. 2022. PMID: 36036514 Free PMC article.
-
Host cell deformability is linked to transmission in the human malaria parasite Plasmodium falciparum.Cell Microbiol. 2012 Jul;14(7):983-93. doi: 10.1111/j.1462-5822.2012.01786.x. Epub 2012 Apr 12. Cell Microbiol. 2012. PMID: 22417683 Free PMC article.
-
A Profound Membrane Reorganization Defines Susceptibility of Plasmodium falciparum Infected Red Blood Cells to Lysis by Granulysin and Perforin.Front Immunol. 2021 May 19;12:643746. doi: 10.3389/fimmu.2021.643746. eCollection 2021. Front Immunol. 2021. PMID: 34093532 Free PMC article.
References
-
- Kanaani J., Ginsburg H. Metabolic interconnection between the human malarial parasite Plasmodium falciparum and its host erythrocyte. Regulation of ATP levels by means of an adenylate translocator and adenylate kinase. J. Biol. Chem. 1989;264:3194–3199. - PubMed
-
- Rudzinska M.A., Trager W., Bray R.S. Pinocytotic uptake and the digestion of hemoglobin in malaria parasites. J. Protozool. 1965;12:563–576. - PubMed
-
- Krugliak M., Zhang J., Ginsburg H. Intraerythrocytic Plasmodium falciparum utilizes only a fraction of the amino acids derived from the digestion of host cell cytosol for the biosynthesis of its proteins. Mol. Biochem. Parasitol. 2002;119:249–256. - PubMed
-
- Ginsburg H., Kutner S., Cabantchik Z.I. Characterization of permeation pathways appearing in the host membrane of Plasmodium falciparum infected red blood cells. Mol. Biochem. Parasitol. 1985;14:313–322. - PubMed
-
- Kirk K. Membrane transport in the malaria-infected erythrocyte. Physiol. Rev. 2001;81:495–537. - PubMed
Publication types
MeSH terms
Substances
Grants and funding
LinkOut - more resources
Full Text Sources
Other Literature Sources
