Multicenter Study
. 2010 Dec;40(3):531-43.
doi: 10.1016/j.nbd.2010.07.013. Epub 2010 Aug 2.

Early changes in the hypothalamic region in prodromal Huntington disease revealed by MRI analysis

Collaborators, Affiliations
Multicenter Study

Early changes in the hypothalamic region in prodromal Huntington disease revealed by MRI analysis

Charlotte Soneson et al. Neurobiol Dis. 2010 Dec.

Abstract

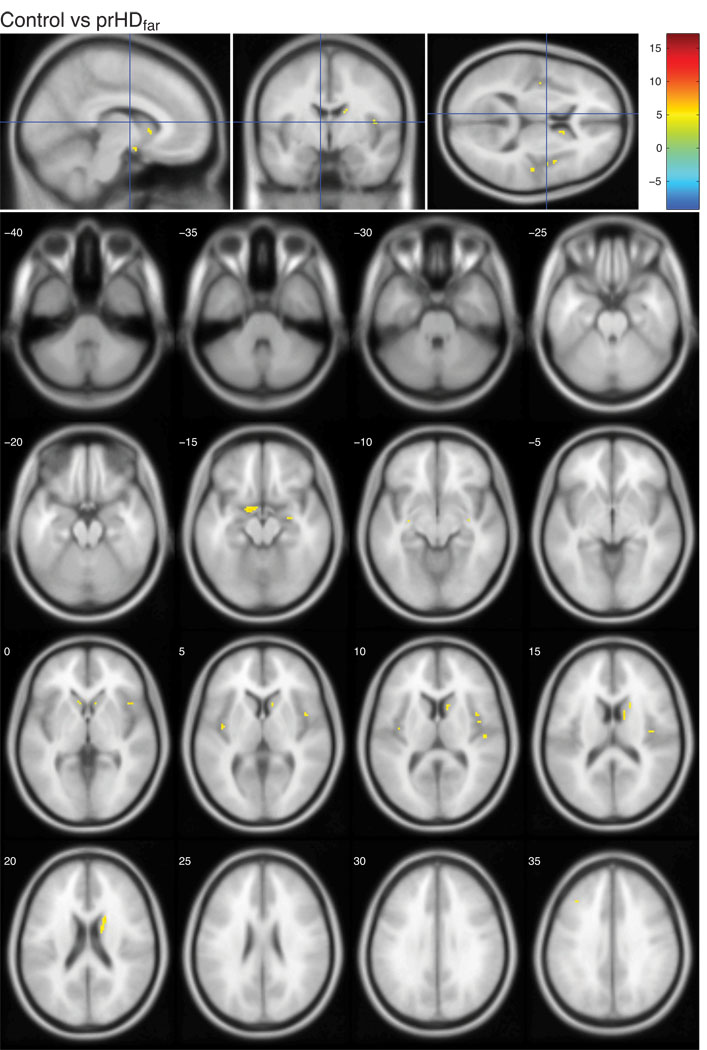
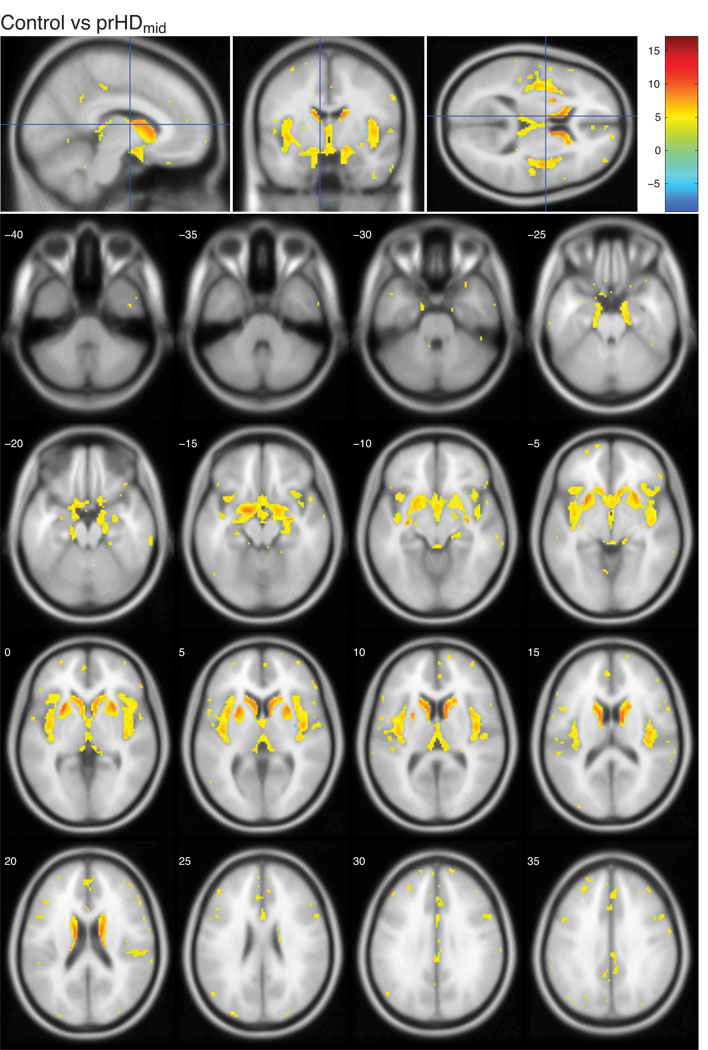
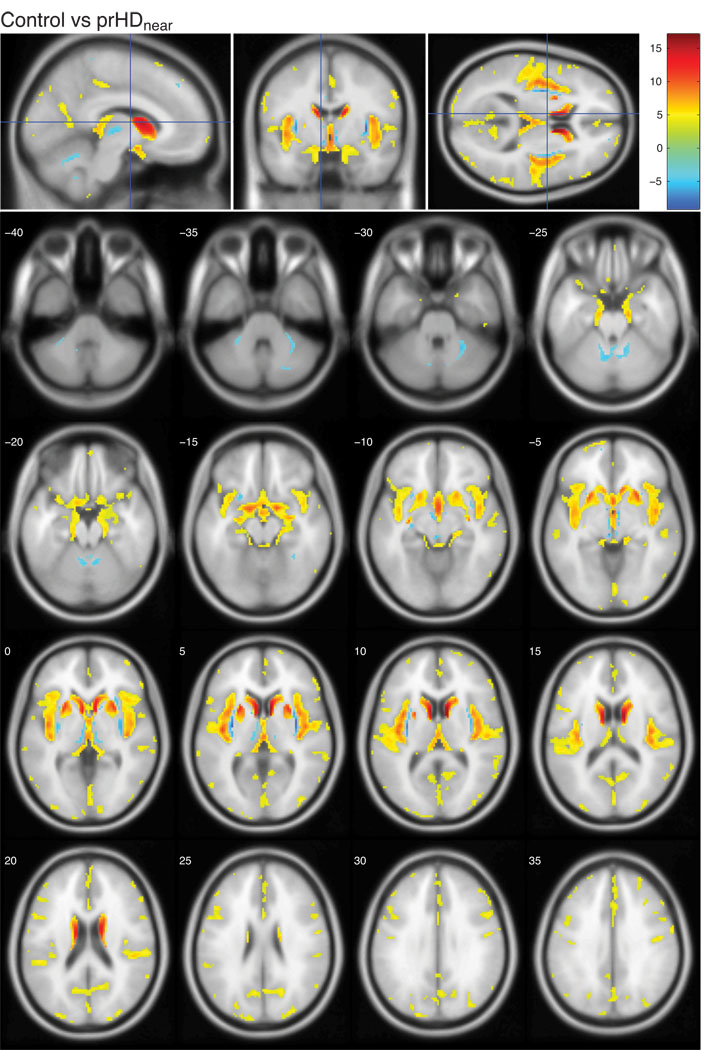
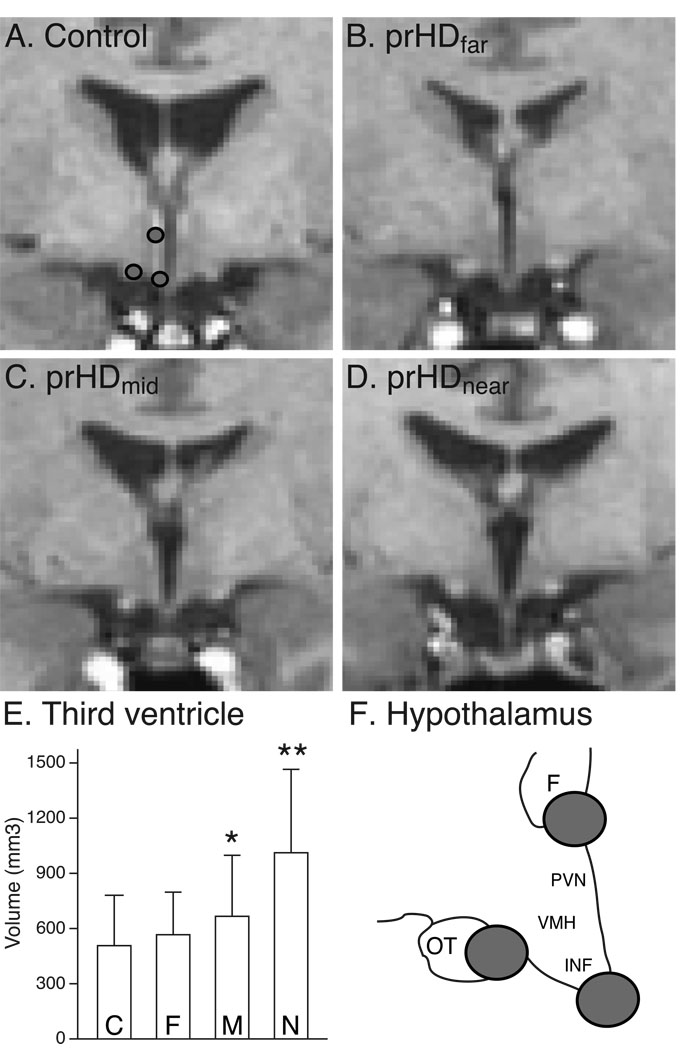
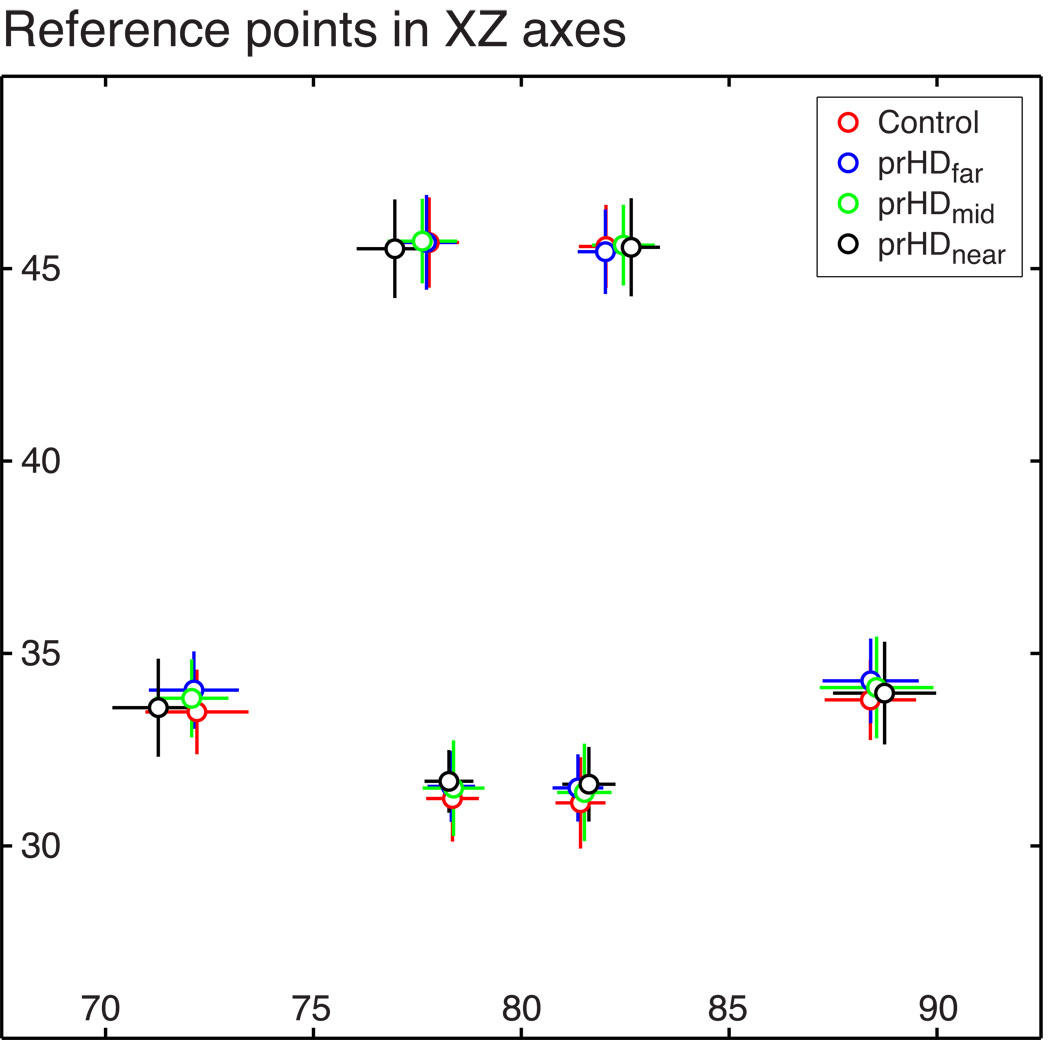
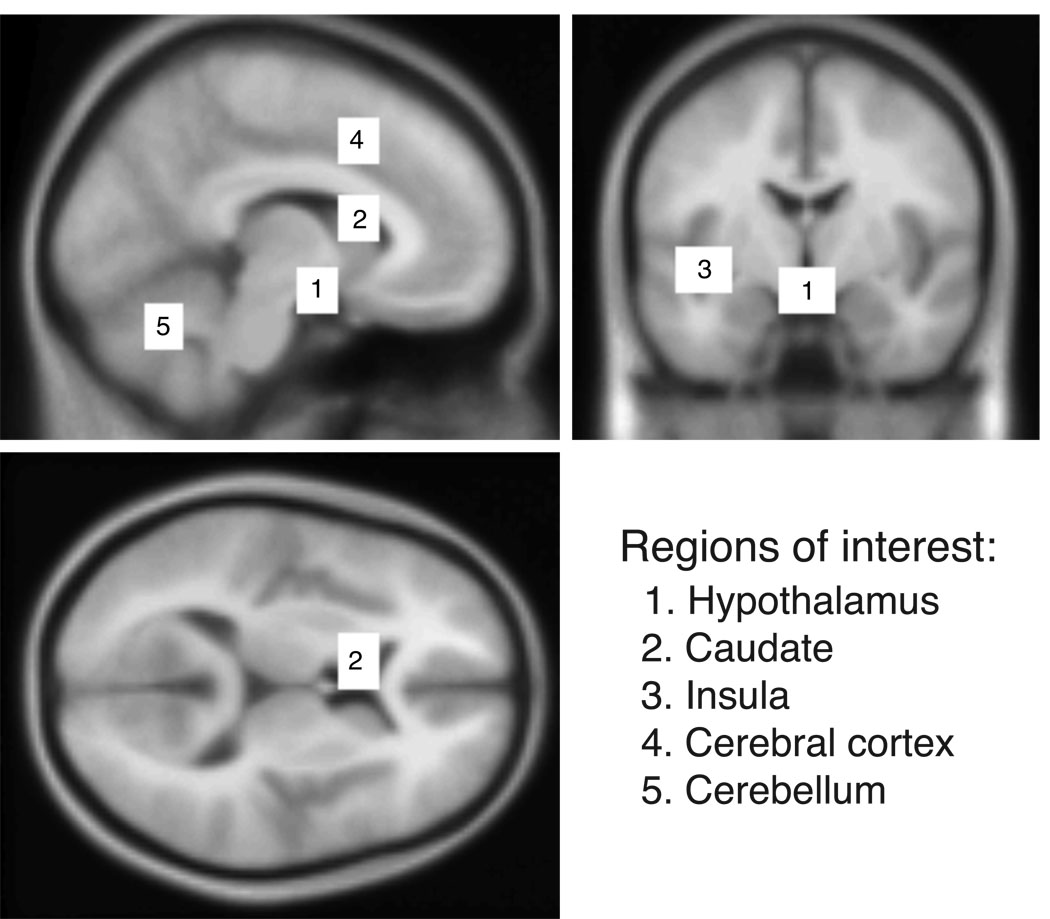
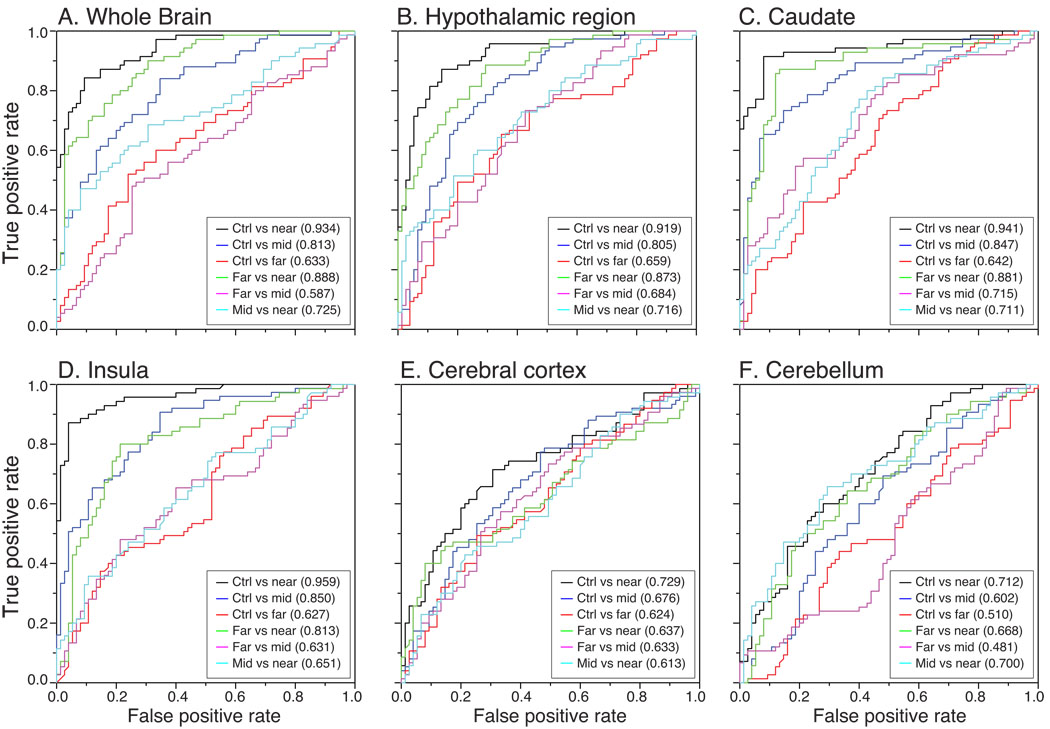
Huntington disease (HD) is a fatal neurodegenerative disorder caused by an expanded CAG repeat. Its length can be used to estimate the time of clinical diagnosis, which is defined by overt motor symptoms. Non-motor symptoms begin before motor onset, and involve changes in hypothalamus-regulated functions such as sleep, emotion and metabolism. Therefore we hypothesized that hypothalamic changes occur already prior to the clinical diagnosis. We performed voxel-based morphometry and logistic regression analyses of cross-sectional MR images from 220 HD gene carriers and 75 controls in the Predict-HD study. We show that changes in the hypothalamic region are detectable before clinical diagnosis and that its grey matter contents alone are sufficient to distinguish HD gene carriers from control cases. In conclusion, our study shows, for the first time, that alterations in grey matter contents in the hypothalamic region occur at least a decade before clinical diagnosis in HD using MRI.


Figures

Figure 1
Figure 1. Voxel-based morphometric analysis of prHDfar and controls in the Predict-HD study
The figures show the t-values in regions with significantly altered grey matter content in the prHDfar group compared to controls. The color bar indicates the range of t-values. Positive t-values indicate a decrease in grey matter content in prHDfar participants compared to controls, negative t-values indicate an increase in prHDfar participants compared to controls. All images are corrected for multiple comparisons using FDR and thresholded at q<0.01. Images are shown in neurological convention, overlaid on a standard MNI152 T1 template and viewed with the xjView toolbox in MATLAB (http://www.alivelearn.net/xjview8/). The top row shows the sections at MNI coordinates (−8,−4,10) mm. The following image shows the same statistical parametric map on a series of transverse slices (from MNI coordinates z = −40 to z = 35, slice thickness 5 mm).
Figure 2
Figure 2. Voxel-based morphometric analysis of prHDmid and controls in the Predict-HD study
The figures show the t-values in regions with significantly altered grey matter content in the prHDmid group compared to controls. The color bar indicates the range of t-values. Positive t-values indicate a decrease in grey matter content in prHDmid participants compared to controls, negative t-values indicate an increase in prHDmid participants compared to controls. All images are corrected for multiple comparisons using FDR and thresholded at q<0.01. Images are shown in neurological convention, overlaid on a standard MNI152 T1 template and viewed with the xjView toolbox in MATLAB (http://www.alivelearn.net/xjview8/). The top row shows the sections at MNI coordinates (−8,−4,10) mm. The following image shows the same statistical parametric map on a series of transverse slices (from MNI coordinates z = −40 to z = 35, slice thickness 5 mm).
Figure 3
Figure 3. Voxel-based morphometric analysis of prHDnear and controls in the Predict-HD study
The figures show the t-values in regions with significantly altered grey matter content in the prHDnear group compared to controls. The color bar indicates the range of t-values. Positive t-values indicate a decrease in grey matter content in prHDnear participants compared to controls, negative t-values indicate an increase in prHDnear participants compared to controls. All images are corrected for multiple comparisons using FDR and thresholded at q<0.01. Images are shown in neurological convention, overlaid on a standard MNI152 T1 template and viewed with the xjView toolbox in MATLAB (http://www.alivelearn.net/xjview8/). The top row shows the sections at MNI coordinates (−8,−4, 10) mm. The following image shows the same statistical parametric map on a series of transverse slices (from MNI coordinates z = −40 to z = 35, slice thickness 5 mm).
Figure 4
Figure 4. Representative images of the hypothalamic region
Representative native-space T1-weighted images from participants in the control (A), prHDfar (B), prHDmid (C) and prHDnear (D) groups at the plane where the six different points on the borders of the hypothalamic region were identified for validation of the normalization process. The locations of the three points in the left hemisphere are shown in (A) and schematically in (F). The images illustrate a widening of the third ventricle in the groups closer to estimated onset of motor symptoms which is confirmed by a volumetric analysis of the third ventricle (E). Data is presented as mean ± SD. C= control, F= prHDfar, M = prHDmid and N = prHDnear . **= p<0.001 (adjusting for age effect and using Bonferroni correction) compared to all other groups; * = p<0.05 (adjusting for age effect and using Bonferroni correction) compared to the control group; F= fornix; IFN= the infundibular nucleus; OT= optical tract; PVN= the paraventricular nucleus of the hypothalamus; VMH= the ventromedial nucleus of the hypothalamus.
Figure 5
Figure 5. Validation of the spatial alignment of the hypothalamic region
The mean positions in the normalized images of the six different points of reference on the hypothalamic borders in a plane 2.7 mm posterior to the anterior commissure did not differ by more than 1 mm in any coordinate direction between any pair of participant groups, which is illustrated in a medio-lateral and dorsal-ventral plane. Data is represented as mean ± SD.
Figure 6
Figure 6. Region of interests used for classification analyses in prHD
The anatomical localizations of the five equally sized regions of interests (22 mm × 16 mm × 18 mm, 792 voxels) in the hypothalamic region (1), the left caudate (2), the left insula (3), the cerebral cortex (4), and the cerebellum (5) that were used for the classification analyses.
Figure 7
Figure 7. ROC curves for the classification accuracy in prHD and control participants
ROC curves obtained using a L2-regularized logistic regression model when contrasting controls participants to the different prHD groups, as well as when contrasting prHD groups to each other for the whole brain (A), and regions of interests in the hypothalamic region (B), the caudate nucleus (C), the insula (D), the cerebral cortex (E) and the cerebellum (F). Areas under the ROC curves are indicated in each graph. In each binary comparison, the “positive” group is considered the one closest to expected clinical onset (with the control group considered further from onset than any of the prHD groups).

References

    1. Arnulf I, Nielsen J, Lohmann E, Schiefer J, Wild E, Jennum P, Konofal E, Walker M, Oudiette D, Tabrizi S, Durr A. Rapid eye movement sleep disturbances in Huntington disease. Arch. Neurol. 2008;65:482–488. - PubMed
    1. Ashburner J, Friston KJ. Voxel-based morphometry--the methods. Neuroimage. 2000;11:805–821. - PubMed
    1. Ashburner J, Friston KJ. Unified segmentation. Neuroimage. 2005;26:839–851. - PubMed
    1. Aylward EH, Sparks BF, Field KM, Yallapragada V, Shpritz BD, Rosenblatt A, Brandt J, Gourley LM, Liang K, Zhou H, Margolis RL, Ross CA. Onset and rate of striatal atrophy in preclinical Huntington disease. Neurology. 2004;63:66–72. - PubMed
    1. Aylward EH. Change in MRI striatal volumes as a biomarker in preclinical Huntington's disease. Brain Res. Bull. 2007;72:152–158. - PubMed

Publication types