

Convulsive status epilepticus duration as determinant for epileptogenesis and interictal discharge generation in the rat limbic system
- PMID: 20682341
- PMCID: PMC4878906
- DOI: 10.1016/j.nbd.2010.07.015
Convulsive status epilepticus duration as determinant for epileptogenesis and interictal discharge generation in the rat limbic system
Abstract
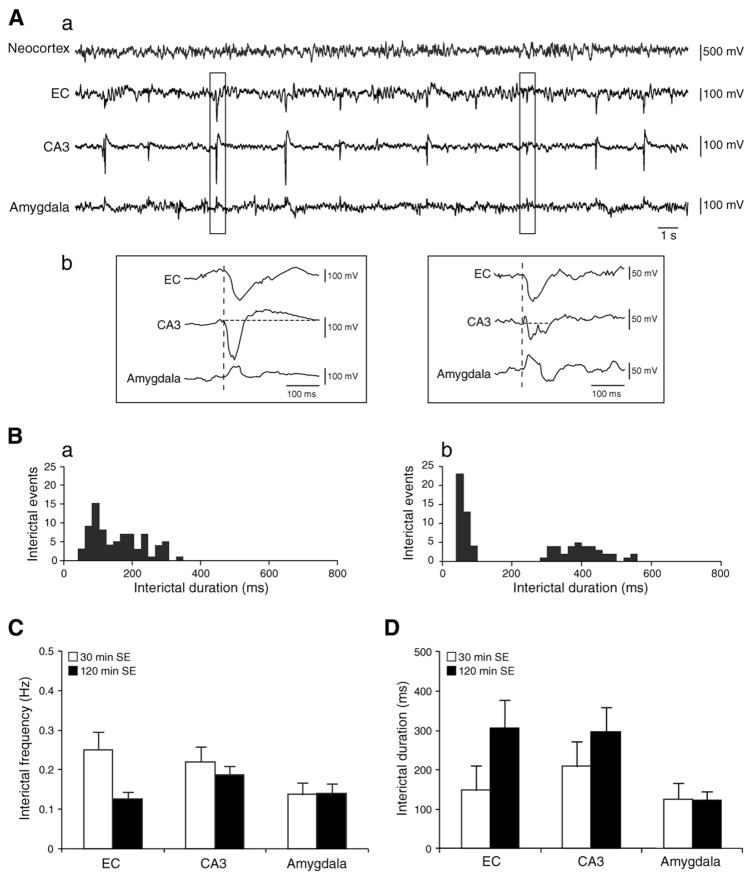
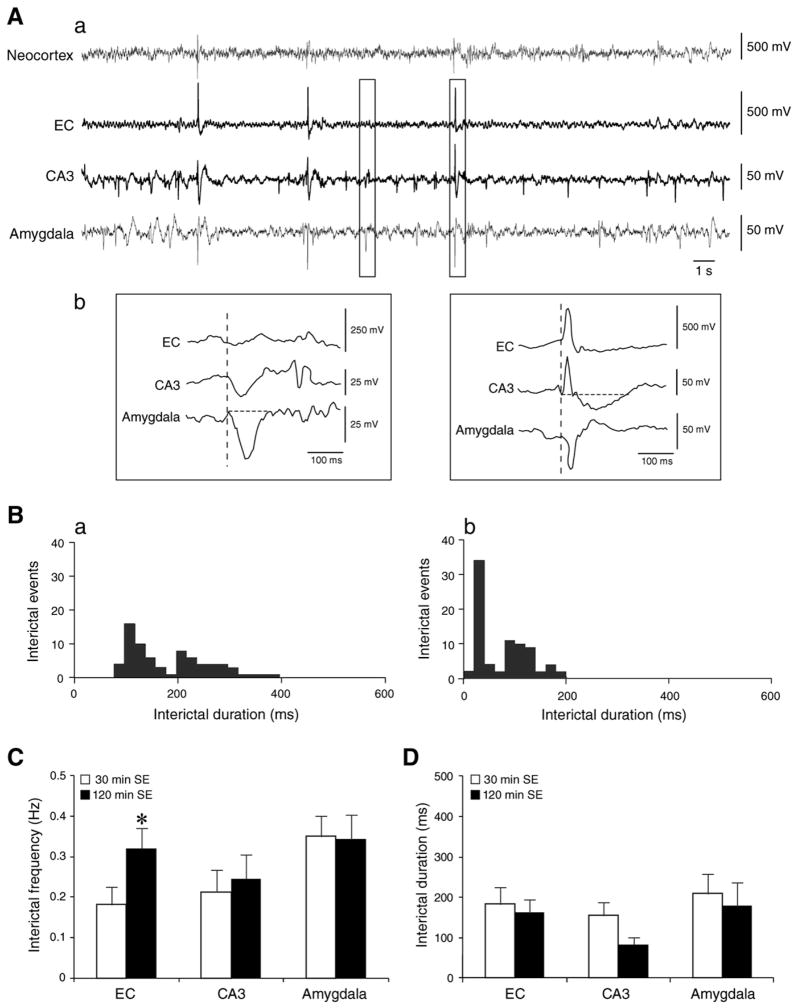
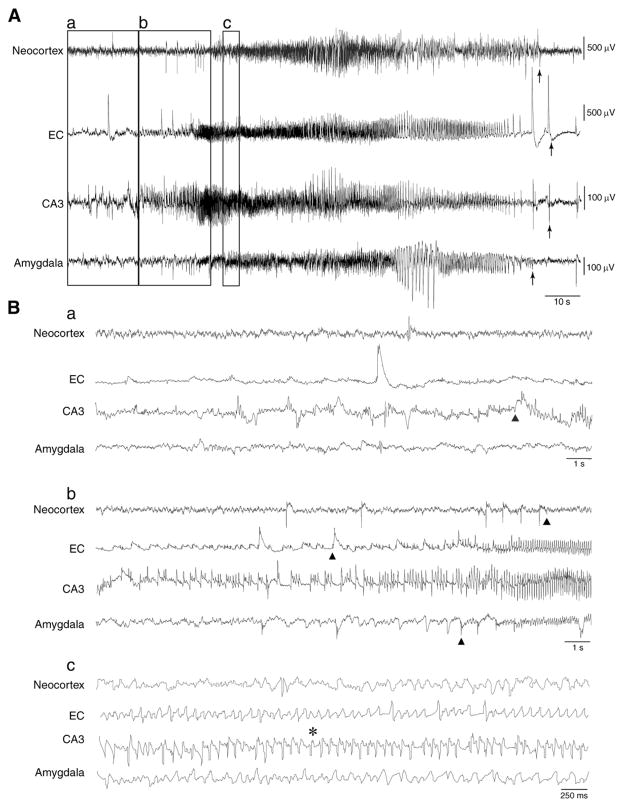
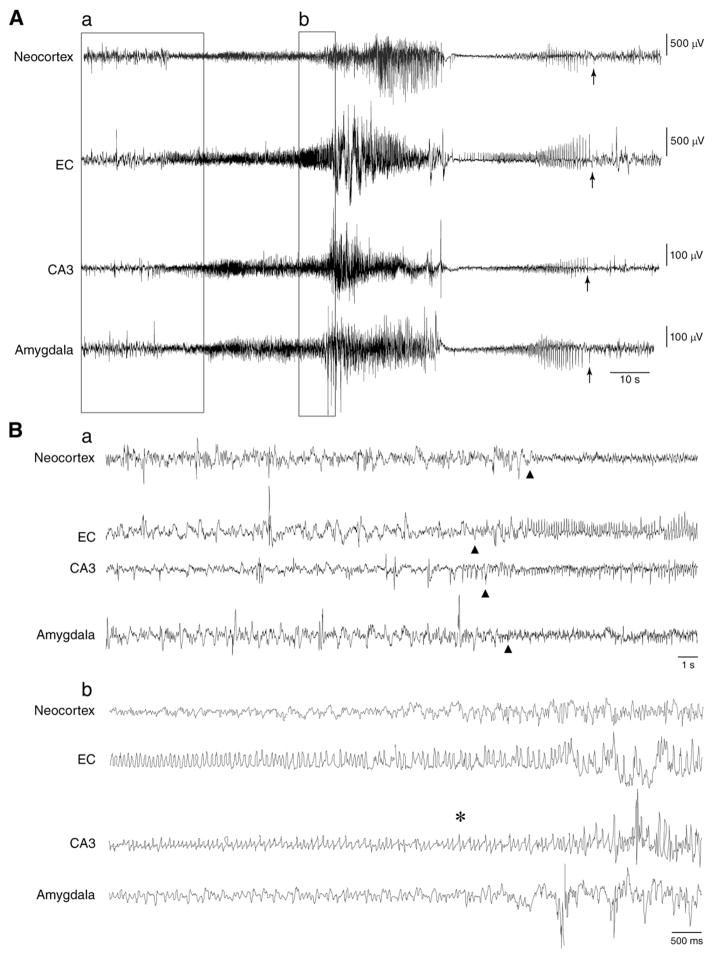
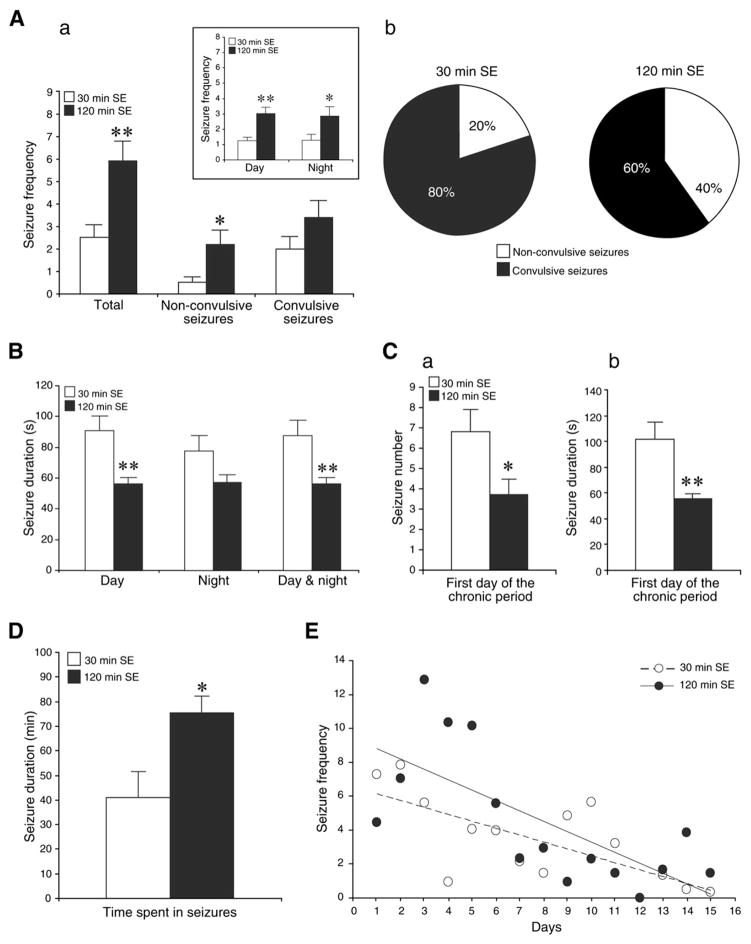
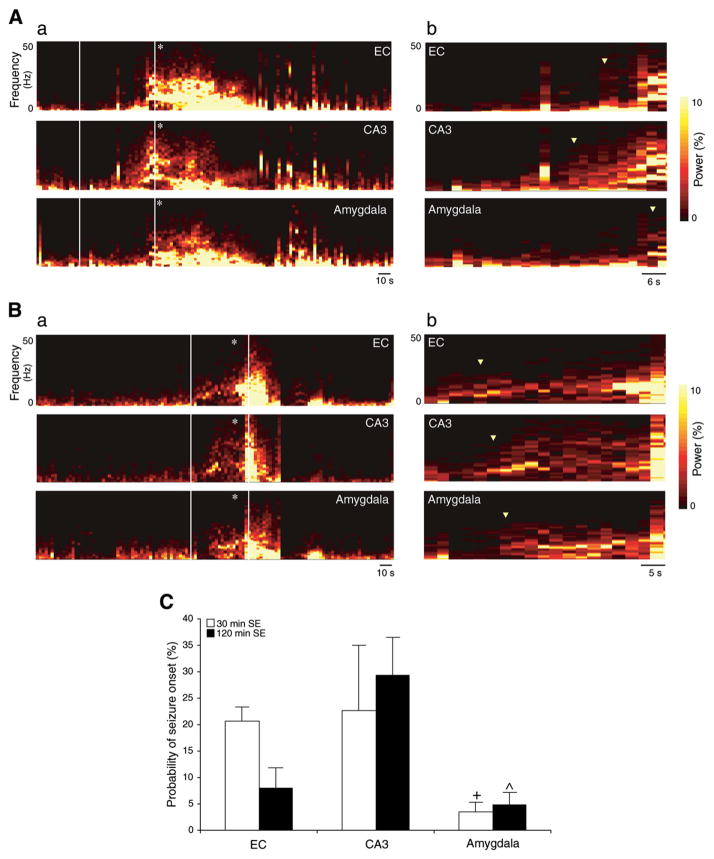
We analyzed with EEG-video monitoring the epileptic activity recorded during the latent and chronic periods in rats undergoing 30 or 120 min pilocarpine-induced convulsive status epilepticus (SE). Interictal discharges frequency in the entorhinal cortex (EC) of animals exposed to 120 min SE was significantly higher in the chronic than in the latent period. Following seizure appearance, interictal spikes diminished in duration in the CA3 of the 120 min SE group, and occurred at higher rates in the amygdala in all animals. Rats exposed to 120 min SE generated shorter seizures but presented twice as many non-convulsive seizures per day as the 30 min group. Finally, seizures most frequently initiated in CA3 in the 120 min SE group but had similar onset in CA3 and EC in the 30 min group. These findings indicate that convulsive SE duration influences the development of interictal and ictal activity, and that interictal discharges undergo structure-specific changes after seizure appearance.
Crown Copyright © 2010. Published by Elsevier Inc. All rights reserved.
Figures
Similar articles
-
Progression of convulsive and nonconvulsive seizures during epileptogenesis after pilocarpine-induced status epilepticus.J Neurophysiol. 2018 May 1;119(5):1818-1835. doi: 10.1152/jn.00721.2017. Epub 2018 Feb 14. J Neurophysiol. 2018. PMID: 29442558
-
Lacosamide modulates interictal spiking and high-frequency oscillations in a model of mesial temporal lobe epilepsy.Epilepsy Res. 2015 Sep;115:8-16. doi: 10.1016/j.eplepsyres.2015.05.006. Epub 2015 May 19. Epilepsy Res. 2015. PMID: 26220372 Free PMC article.
-
Do interictal discharges promote or control seizures? Experimental evidence from an in vitro model of epileptiform discharge.Epilepsia. 2001;42 Suppl 3:2-4. doi: 10.1046/j.1528-1157.2001.042suppl.3002.x. Epilepsia. 2001. PMID: 11520313 Review.
-
High-frequency (80-500 Hz) oscillations and epileptogenesis in temporal lobe epilepsy.Neurobiol Dis. 2011 Jun;42(3):231-41. doi: 10.1016/j.nbd.2011.01.007. Epub 2011 Jan 14. Neurobiol Dis. 2011. PMID: 21238589 Free PMC article.
-
Interictal-ictal interactions and limbic seizure generation.Rev Neurol (Paris). 1999 Jul;155(6-7):468-71. Rev Neurol (Paris). 1999. PMID: 10472661 Review.
Cited by
-
Immediate Epileptogenesis after Kainate-Induced Status Epilepticus in C57BL/6J Mice: Evidence from Long Term Continuous Video-EEG Telemetry.PLoS One. 2015 Jul 10;10(7):e0131705. doi: 10.1371/journal.pone.0131705. eCollection 2015. PLoS One. 2015. PMID: 26161754 Free PMC article.
-
Spontaneous recurrent seizures in an intra-amygdala kainate microinjection model of temporal lobe epilepsy are differentially sensitive to antiseizure drugs.Exp Neurol. 2022 Mar;349:113954. doi: 10.1016/j.expneurol.2021.113954. Epub 2021 Dec 17. Exp Neurol. 2022. PMID: 34922908 Free PMC article.
-
Seizure clusters.J Drug Assess. 2021 Aug 14;10(1):86-90. doi: 10.1080/21556660.2021.1962671. eCollection 2021. J Drug Assess. 2021. PMID: 34408916 Free PMC article. Review.
-
Differential Impact of Severity and Duration of Status Epilepticus, Medical Countermeasures, and a Disease-Modifier, Saracatinib, on Brain Regions in the Rat Diisopropylfluorophosphate Model.Front Cell Neurosci. 2021 Oct 15;15:772868. doi: 10.3389/fncel.2021.772868. eCollection 2021. Front Cell Neurosci. 2021. PMID: 34720886 Free PMC article.
-
Status Epilepticus: Behavioral and Electroencephalography Seizure Correlates in Kainate Experimental Models.Front Neurol. 2018 Jan 23;9:7. doi: 10.3389/fneur.2018.00007. eCollection 2018. Front Neurol. 2018. PMID: 29410648 Free PMC article. Review.
References
-
- Barbarosie M, Louvel J, Kurcewicz I, Avoli M. CA3-released entorhinal seizures disclose dentate gyrus epileptogenicity and unmask a temporoammonic pathway. J Neurophysiol. 2000;83:1115–1124. - PubMed
-
- Bartolomei F, Barbeau E, Gavaret M, Guye M, McGonigal A, Régis J, et al. Cortical stimulation study of the role of rhinal cortex in déjà vu and reminiscence of memories. Neurology. 2004;63:858–864. - PubMed
-
- Ben-Ari Y, Cossart R. Kainate, a double agent that generates seizures: two decades of progress. Trends Neurosci. 2000;23:580–587. - PubMed
Publication types
MeSH terms
Substances
Grants and funding
LinkOut - more resources
Full Text Sources
Medical
Miscellaneous
