. 2010 Aug 6;7(2):198-213.
doi: 10.1016/j.stem.2010.05.022.

Transient inactivation of Rb and ARF yields regenerative cells from postmitotic mammalian muscle

Affiliations

Transient inactivation of Rb and ARF yields regenerative cells from postmitotic mammalian muscle

Kostandin V Pajcini et al. Cell Stem Cell. .

Abstract

An outstanding biological question is why tissue regeneration in mammals is limited, whereas urodele amphibians and teleost fish regenerate major structures, largely by cell cycle reentry. Upon inactivation of Rb, proliferation of postmitotic urodele skeletal muscle is induced, whereas in mammalian muscle this mechanism does not exist. We postulated that a tumor suppressor present in mammals but absent in regenerative vertebrates, the Ink4a product ARF (alternative reading frame), is a regeneration suppressor. Concomitant inactivation of Arf and Rb led to mammalian muscle cell cycle reentry, loss of differentiation properties, and upregulation of cytokinetic machinery. Single postmitotic myocytes were isolated by laser micro-dissection-catapulting, and transient suppression of Arf and Rb yielded myoblast colonies that retained the ability to differentiate and fuse into myofibers upon transplantation in vivo. These results show that differentiation of mammalian cells is reversed by inactivation of Arf and Rb and support the hypothesis that Arf evolved at the expense of regeneration.


Figures

Figure 1
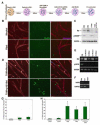
Figure 1. Suppression of Rb is sufficient for cell-cycle reentry in C2C12 myotubes
(A) Schematic representation of the treatment of C2C12 myotubes. (B) sqRT-PCR of Rb expression timecourse in hours following treatment with mocksi or Rbsi. GAPDH expression shown as RNA loading control. (C) Western blot of protein expression levels of Rb (100 kDa) in C2C12 myoblasts (GM), myotubes (DM4), and myotubes at DM3 and DM4, 24hrs and 48hrs respectively after treatment with Rb-siRNA. GAPDH (35 kDa) as a loading control. (D) Histogram representing the levels of Rb in GM, in DM4 and in DM4 treated with Rb-siRNA for 48hrs. Samples are normalized to Rb levels of DM4 myotubes. (E) Histogram represents BrdU incorporation in myonuclei of myotubes in day 4 of differentiation (DM4), at least 36hrs following Rbsi treatment. A minimum of 500 nuclei were counted from random fields for each trial. (F) Immunofluorescence images from mock treated DM4 C2C12 myotubes and 200nM Rbsi-treated myotubes in DM4 and DM5. Myotubes were labeled with primary antibody for MHC (red) and BrdU (green), as well as with Hoechst 33258 dye (blue). Bar, 150μm. Growth medium (GM); Myotubes cultured in differentiation medium for 4 or 5 days (DM4 or DM5 respectively). Error bars indicate the mean ± SE of at least three independent experiments, P value was determined with a t test (*P<0.05, **P<0.01).
Figure 2
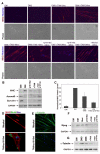
Figure 2. Suppression of Rb and p16/19 is necessary for cell-cycle reentry in primary myotubes
(A) Schematic representation of the treatment of primary myotubes with either tamoxifen (TAM) and/or siRNA. (B) Immunofluorescence images from mock si-Glo treated primary myotubes and Rbsi treated myotubes. Myotubes were labeled with primary antibody for MHC (red) and BrdU (green), as well as with Hoechst 33258 dye (blue). Bar, 50μm. (C) Western blot of primary myotube protein levels; Rb (100 kDa) and p19ARF (20 kDa) in GM and DM5, after TAM treatment or TAM and p16/19si treatment. GAPDH (35 kDa) as loading control. (D) Immunofluorescence images indicating BrdU incorporation in TAM and mock siGlo treated primary myotubes compared to TAM and p16/19si-RNA treated primary myotubes. (E) sqRT-PCR showing Rb and Ink4a (p16/19) expression in primary myotubes as well as in two different C2C12 myotube populations treated with Mocksi or Rbsi. (F) sq-PCR amplification using primers for the shared exon 2-3 region of the ink4a locus, from genomic DNA prepared from primary myoblasts and C2C12 myoblasts. (G) Histogram represents BrdU incorporation in primary myotube nuclei at DM5, following suppression of Rb with either siRNA or TAM. (H) Histogram represents BrdU incorporation in primary myotube nuclei following treatment with TAM and siRNAs against ink4a gene products. A minimum of 500 nuclei were counted from random fields for each trial in F and G. Error bars indicate the mean ± SE of at least three independent experiments. (*P<0.01).
Figure 3
Figure 3. Dedifferentiation of mature myotubes
(A) Immunofluorescence images of primary myoblasts and myotubes cultured for indicated times in DM and treated with TAM and either non-specific siRNA (Mocksi) or p16/19si at the indicated time points. Myotubes were labeled with primary antibodies for MHC (red), and Hoechst 33258 (blue). Bottom panels: phase images of the same image fields. Bar, 150μm. (B) Western blot analysis of primary myoblasts in GM and DM5 showing expression of MHC (220 kDa), AuroraB (38 kDa) and Survivin (20 kDa) as well as expression of these same proteins in myotubes after treatment for at least 48hrs with siRNA against p16/19, with TAM or both TAM and p16/19si. (C) MHC protein levels normalized to differentiated myotube cultures. Primary myotubes were treated with TAM or TAM and p16/19si. Growth medium (GM), Differentiation medium (DM). Error bars indicate the mean ± SE of at least three independent experiments. (D) Representative immunofluorescence images of DM6 primary myotubes treated with EtOH and non-specific siRNA or TAM and p16/19si for at least 48hrs. Myotubes were labeled with primary antibodies for MHC (red), BrdU (green), and Hoechst 33258 (blue). (E) Representative immunofluorescence images of primary DM6 myotubes after Mocksi or TAM and p16/19si treatment. Myotubes were labeled with primary antibodies for α-tubulin (green) and Hoechst 33258 (blue). (F) Western blot analysis of Myogenin (36 kDa) and (G) α-tubulin (50 kDa) in primary myoblasts and myotubes treated as indicated with siRNA and/or TAM. In each of the blots, GAPDH (35 kDa) is the loading control. Growth medium (GM); Myotubes were cultured in differentiation medium for 3 or 6 days (DM3 or DM6 respectively).
Figure 4
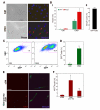
Figure 4. Myogenin-expressing myocytes enter S-phase only after loss of Rb and ink4a gene products
(A) Immunofluorescence images of myoblasts (GM) and myocytes (DM3) infected with pLE-myog3R-GFP. Cells were labeled with primary antibodies for GFP (green), myogenin (red) and Hoechst 33258 (blue). Bar 50μm. (B.) (i) Histogram represents percentage of GFP-positive (green bars) and myogenin-positive (red bars) cells in growth medium (GM) or differentiation medium (DM3). A minimum of 1000 nuclei were counted from random fields for each trial. Error bars indicate the mean ± SE of at least three independent experiments. (*P<0.005). (ii) Histogram represents percentage of GFP-positive cells that also express detectable myogenin by immunostaining. Individual cells were evaluated for expression of each marker. A minimum of 250 cells were counted from random fields. Error bars indicate the mean ± SE of three independent experiments. (C) Representative FACS plots of myoblasts (GM) and myocytes (DM3) infected with retroviral pLE-myog3R-GFP construct. Gated population indicates GFP-positive myocyte population employed in subsequent experiments. (D) Histogram representation of GFP expression in three independent experimental FACS profiles on myoblasts (GM) and myocytes (DM3) (*P<0.001). (E) Immunofluorescence images of GFP-positive FACS-sorted myocytes cultured in conditioned GM only (cGM) or in cGM with TAM and p16/19si-RNA. Cells were labeled for Ki67 (red) and GFP (green) as well as Hoechst 33258 (blue). Bar 50μm. (F) Histogram represents percent of Ki67-positive nuclei in GFP-positive FACS sorted population, in cGM, treated with TAM and p16/19si, or treated with Rbsi and p16/19si-RNA in tandem (DKD). Growth medium (GM); A minimum of 100 nuclei were counted from random fields for each trial. Error bars indicate the mean ± SE of three independent experiments. (*P<0.01, **P<0.005).
Figure 5
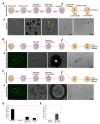
Figure 5. Laser microdissection and PALM LPC; single-cell isolation and clonal expansion of dedifferentiated myocytes
(A. i) Schematic representations of the culture conditions, treatment with Mock siRNA, and isolation by laser microdissection and catapulting of myogenin-GFP+ myocytes. Diagram also shows the fate of isolated cells 72 and 96hrs after isolation. (A.ii) Representative images of mock-treated myocyte (DM4) (panels left to right) prior to microdissection, immediately after microdissection, after LPC isolation, 72hrs post-isolation and 96hrs post-isolation. Bar 50μm, 100μm. (B. i) Schematic representations of the culture conditions, treatment with TAM and p16/19 siRNA, and isolation by laser microdissection and catapulting of myogenin-GFP+ myocytes. Diagram also shows the fate of isolated cells 72 and 96hrs after isolation. (B.ii) Representative image of TAM and p1619si-RNA treated myocyte (DM4); First panel- native GFP expression marks myogenin expression prior to microdissection. Second panel- the same cell during microdissection, Third panel-after LPC isolation, Fourth panel- 96hrs post-isolation and visualization of expansion. Bar 50μm, 100μm. (C. i) Schematic representations of the culture conditions, treatment with Rb and p16/19 siRNA , and isolation by laser microdissection and catapulting of myogenin-GFP+ myocytes. Diagram also shows the fate of isolated cells 72 and 96hrs after isolation. (C.ii) Representative image of DKD treated myocyte; First panel- GFP expression marks myogenin expression prior to microdissection. Second panel- the same cell after microdissection. Third panel- after LPC. Fourth panel- 72hrs post-isolation with visualization of expansion. Bar 50μm, 200μm. (D) Histogram represents percentage of colony formation after PALM LPC cell isolation. Error bars indicate the mean ± SE of at least five independent experiments, in which at least 50 membranes were captured for each myocyte trial, and at least 20 myoblast membranes were captured to verify cell survival and capture efficiency. (E) Histogram represents percentage of colony formation after PALM LPC cell isolation following FACS isolation of GFP+ myocyte population as indicated by the scheme in Figure S5 A. Error bars indicate the mean ± SE of at least four independent experiments, in which at least 50 membranes were captured for each myocyte trial. Primary muscle cells were differentiated for 4 days (DM4) at the time of LPC isolation.
Figure 6
Figure 6. Dedifferentiated myocytes are capable of expansion and redifferentation into mature myotubes
(A) Phase contrast images of Rbsi and p16/19si double-knockdown captured (DKDcap) myocyte colonies and TAM with p16/19si captured myocyte (TAMcap) colonies at DM4, prior to protein harvest for expression analysis. Bar 150μm (B) Western blot analysis of captured colonies in GM and DM arranged from left to right according to their differentiated morphologies in DM4; protein levels of Rb (100 kDa), p19ARF (20 kDa), myogenin (36 kDa), MHC (220 kDa) and Survivin (20 kDa) as well as GAPDH (35 kDa) as a loading control. (C) Representative images of two DKDcap myocyte colonies in DM4, labeled for GFP (green) and myogenin (red) as well as Hoechst 33258 (blue). Bar 25μm. (D) Representative images of TAMcap myocyte colony in DM4 labeled for MHC (red) and Hoechst 33258 (blue), a portion of which (lower panels) was infected with retrovirus re-introducing Rb expression. Bar 50μm. (E) Western blot analysis of Pax-7 protein (57 kDa) levels in muscle cells in GM, DM at indicated time points and with indicated treatments, and in the DKDcap dedifferentiated clones. (F) Western blot analysis of M-cadherin protein (88 kDa) and MyoD (34 kDa) levels in primary muscle cells under growth conditions (GM), differentiated conditions (DM6) with indicated treatments, and in the isolated dedifferentiated clones (DKDcap1 and DKDcap2) in GM and DM4 (DM).
Figure 7
Figure 7. Dedifferentiated myocytes are capable of fusing to muscle in vivo
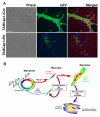
(A) Representative cross-sections of tibialis anterior 10 days post-injection of 2.5 ×10⁵ cells from TAMcap1 and TAMcap1+Rb clonally expanded myocytes (see Fig. 6). Incorporation of dedifferentiated myocytes into pre-existing fibers can be visualized in merged fields by GFP+ staining (green) of laminin-bound fibers (red), nuclei (blue); to enhance visualization, cells were infected with a constitutive-eGFP expressing retroviral vector prior to injection. (n=4, three of which had GFP+ fibers detected) Bar 50μm. (B) Schematic representation of the events following suppression of Rb and p19ARF in primary differentiated myocytes and multi-nucleated myotubes.

Similar articles

Cited by

References

    1. Bartolini F, Gundersen GG. Generation of noncentrosomal microtubule arrays. Journal of cell science. 2006;119(Pt 20):4155–4163. - PubMed
    1. Bersell K, Arab S, Haring B, Kuhn B. Neuregulin1/ErbB4 signaling induces cardiomyocyte proliferation and repair of heart injury. Cell. 2009;138(2):257–270. - PubMed
    1. Blais A, van Oevelen CJ, Margueron R, Acosta-Alvear D, Dynlacht BD. Retinoblastoma tumor suppressor protein-dependent methylation of histone H3 lysine 27 is associated with irreversible cell cycle exit. The Journal of cell biology. 2007;179(7):1399–1412. - PMC - PubMed
    1. Blau HM, Baltimore D. Differentiation requires continuous regulation. The Journal of cell biology. 1991;112(5):781–783. - PMC - PubMed
    1. Blau HM, Pavlath GK, Hardeman EC, Chiu CP, Silberstein L, Webster SG, Miller SC, Webster C. Plasticity of the differentiated state. Science (New York, NY. 1985;230(4727):758–766. - PubMed

Publication types

MeSH terms

Substances