. 2010 Aug 6;7(2):249-57.
doi: 10.1016/j.stem.2010.06.015.

Chromatin structure and gene expression programs of human embryonic and induced pluripotent stem cells

Affiliations

Chromatin structure and gene expression programs of human embryonic and induced pluripotent stem cells

Matthew G Guenther et al. Cell Stem Cell. .

Abstract

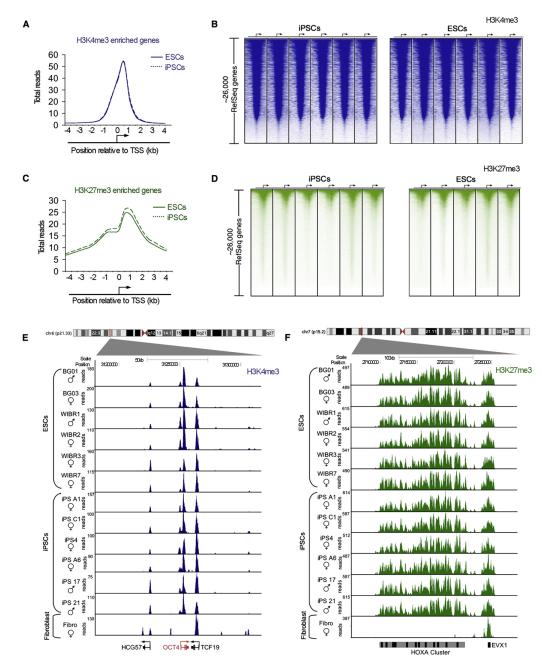
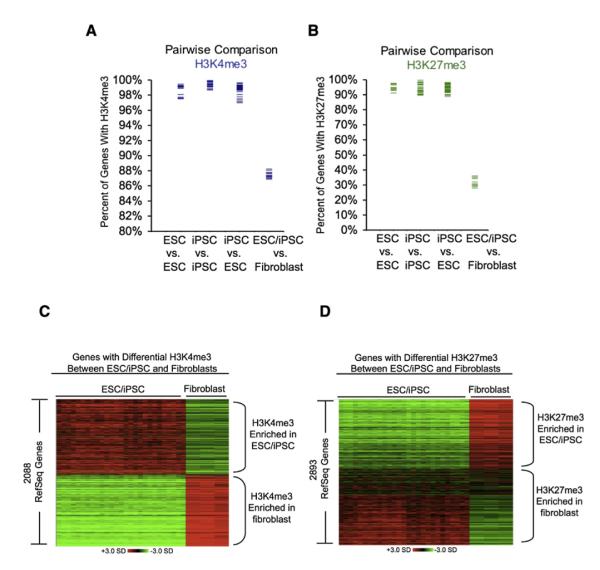
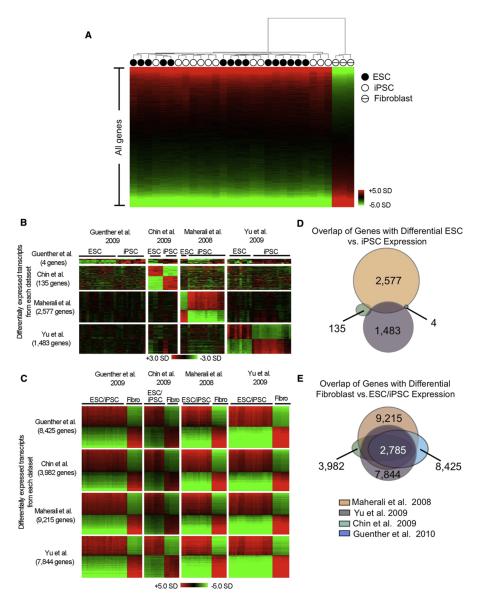
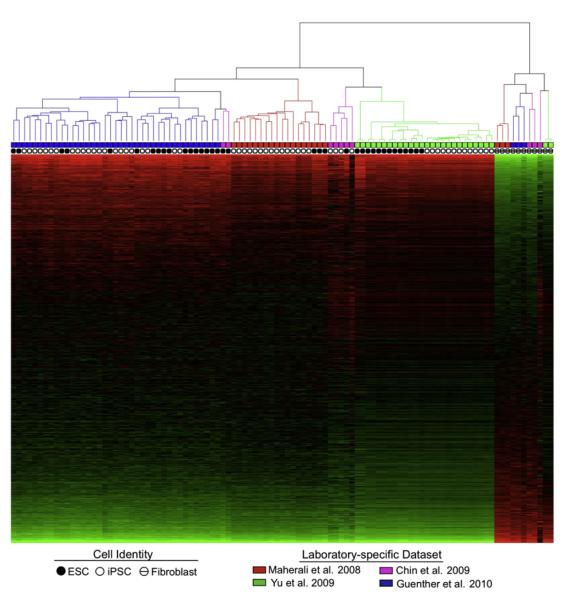
Knowledge of both the global chromatin structure and the gene expression programs of human embryonic stem cells (ESCs) and induced pluripotent stem cells (iPSCs) should provide a robust means to assess whether the genomes of these cells have similar pluripotent states. Recent studies have suggested that ESCs and iPSCs represent different pluripotent states with substantially different gene expression profiles. We describe here a comparison of global chromatin structure and gene expression data for a panel of human ESCs and iPSCs. Genome-wide maps of nucleosomes with histone H3K4me3 and H3K27me3 modifications indicate that there is little difference between ESCs and iPSCs with respect to these marks. Gene expression profiles confirm that the transcriptional programs of ESCs and iPSCs show very few consistent differences. Although some variation in chromatin structure and gene expression was observed in these cell lines, these variations did not serve to distinguish ESCs from iPSCs.


Figures

Figure 1
Figure 1. Genome-wide Maps of Chromatin Modifications Show Human iPSCs Share Key Features with ESCs
(A) Composite H3K4me3 enrichment profile for all RefSeq genes in ESCs (solid blue) and iPSCs (dashed blue). The transcription start site (TSS) and direction of transcription of the average gene is noted by an arrow. (B) ChIP-Seq density heat map of histone H3K4me3 (blue) for all RefSeq genes. Gene order was determined by highest average ChIP-Seq density in ESCs and arranged from highest to lowest density. The TSS and direction of transcription of genes is indicated by an arrow and the genomic region from −4.5kb to +4.5kb relative to the TSS shown. (C) Composite H3K27me3 enrichment profile for all RefSeq genes enriched for H3K27me3 in ESCs (solid green) and iPSCs (dashed green). The TSS and direction of transcription of the average gene is noted by an arrow. (D) ChIP-Seq density heat map of histone H3K27me3 (green) for all RefSeq genes. Gene order was determined by highest average ChIP-Seq density in ESCs and arranged from highest to lowest density. The TSS and direction of transcription of genes is indicated by an arrow and the genomic region from −4.5kb to +4.5kb relative to the TSS shown. (E) ChIP-Seq density for H3K4me3 (blue) at the OCT4 locus in human ESC, iPSC, and fibroblast cell lines. The position of the loci within chromosome 6 and the scale is shown above the gene tracks. (F) ChIP-Seq density for H3K27me3 (green) in the HOXA cluster in human ESC, iPSC, and fibroblast cell lines. The position of the cluster within chromosome 7 and the scale is shown above the gene tracks. See also Tables S1–S4.
Figure 2
Figure 2. Similarity in Genes and Regions Occupied by Modified Histones in ESCs and iPSCs
(A) Pairwise comparisons of genes occupied by H3K4me3 in ESCs, iPSCs, and fibroblast cells. Each blue bar represents an individual pairwise comparison of the set of genes identified as enriched in one cell line with the set enriched in a second cell line. Comparisons between two ESC lines (ESC versus ESC), between two iPS lines (iPSC versus iPSC), between an ESC line and an iPSC line (ESC versus iPSC), and between an ESC or iPSC line and fibroblast cells (ESC/iPSC versus fibroblast) are shown in separate columns. Gene occupancy was determined as described in Supplemental Experimental Procedures. (B) Pairwise comparisons of genes occupied by H3K27me3 in ESCs, iPSCs, and fibroblast cells. Each green bar represents an individual pairwise comparison of the set of genes identified as enriched in one cell line with the set enriched in a second cell line as in (A). (C) Expression data for genes differentially occupied by H3K4me3 in pluripotent cells (ESCs and iPSCs) and fibroblast cells. Genes are ordered by the magnitude of differential H3K4me3 occupancy and relative gene expression is shown. Samples with higher than average expression are shown in red and samples with lower than average expression are shown in green (scale in standard deviations). (D) Expression data for genes differentially occupied by H3K27me3 in pluripotent cells (ESCs and iPSCs) and fibroblast cells. Genes are ordered by the magnitude of differential H3K27me3 occupancy and relative gene expression is shown. Samples with higher than average expression are shown in red and samples with lower than average expression are shown in green (scale in standard deviations). See also Figure S1 and Tables S1–S4.
Figure 3
Figure 3. Limited Variation in Gene Expression between Human ESCs and iPSCs
(A) Unsupervised hierarchical clustering of whole genome expression data from ESCs (closed circle), iPSCs (open circle), and fibroblasts (hashed circle). Expression data was ordered by the magnitude of differential expression between pluripotent cells (ESCs or iPSCs) and fibroblast cells. Normalization and analysis for all expression data is described in Supplemental Experimental Procedures. (B) Differential gene expression between ESCs and iPSCs across multiple expression data sets. For each data set (top to bottom) the transcripts with statistically significant differential expression between ESCs and iPSCs are shown. Within the set of differentially expressed transcripts from each data set, expression data was ordered by the statistical significance of differential expression between ESCs and iPSCs and then aligned to all other data sets for comparison. Samples with higher than average expression are shown in red and samples with lower than average expression are shown in green (scale in standard deviations).
Figure 4
Figure 4. Human ESC and iPSC Expression Data Clusters More by Laboratory than by ESC/iPSC Identity
Gene expression data sets for human ESCs, iPSCs, and fibroblast cells from four laboratories (Guenther et al., present study; Maherali et al., 2008; Chin et al., 2009; Yu et al., 2009) were quantile normalized as one group. Genes were Z score normalized and data were subjected to hierarchical clustering (centered correlation distance, centroid linkage) of samples. Genes were ordered from greatest to least magnitude of differential expression between pluripotent and fibroblast cells. Solid circles indicate ESC samples, empty circles indicate iPSC samples, and hashed circles represent fibroblast cell samples. Data from individual labs are coded by color as Guenther et al. (blue), Maherali et al. (red), Chin et al. (purple), and Yu et al. (green). See also Table S5. (C) Differential gene expression between fibroblasts and pluripotent cells (ESCs and iPSCs). Expression data were ordered by the statistical significance of differential expression between fibroblasts and ESCs/iPSCs in each data set and then aligned to all other data sets for comparison. Samples with higher than average expression are shown in red and samples with lower than average expression are shown in green (scale in standard deviations). (D) Overlap of differentially expressed genes between ESCs and iPSCs in various expression data sets. The numbers of genes differentially expressed between ESCs and iPSCs are indicated in black. The total overlap of all gene sets is zero. (E) Overlap of differentially expressed genes between fibroblast and pluripotent cells (ESCs and iPSCs) in various expression data sets. The numbers of genes differentially expressed between fibroblast and pluripotent cells are indicated in black. The total overlap of all gene sets is shown in white. See also Figure S2 and Table S5.

Comment in

Similar articles

Cited by

References

    1. Aoi T, Yae K, Nakagawa M, Ichisaka T, Okita K, Takahashi K, Chiba T, Yamanaka S. Generation of pluripotent stem cells from adult mouse liver and stomach cells. Science. 2008;321:699–702. - PubMed
    1. Bammler T, Beyer RP, Bhattacharya S, Boorman GA, Boyles A, Bradford BU, Bumgarner RE, Bushel PR, Chaturvedi K, Choi D, et al. Members of the Toxicogenomics Research Consortium Standardizing global gene expression analysis between laboratories and across platforms. Nat. Methods. 2005;2:351–356. - PubMed
    1. Bernstein BE, Humphrey EL, Erlich RL, Schneider R, Bouman P, Liu JS, Kouzarides T, Schreiber SL. Methylation of histone H3 Lys 4 in coding regions of active genes. Proc. Natl. Acad. Sci. USA. 2002;99:8695–8700. - PMC - PubMed
    1. Bernstein BE, Mikkelsen TS, Xie X, Kamal M, Huebert DJ, Cuff J, Fry B, Meissner A, Wernig M, Plath K, et al. A bivalent chromatin structure marks key developmental genes in embryonic stem cells. Cell. 2006;125:315–326. - PubMed
    1. Boland MJ, Hazen JL, Nazor KL, Rodriguez AR, Gifford W, Martin G, Kupriyanov S, Baldwin KK. Adult mice generated from induced pluripotent stem cells. Nature. 2009;461:91–94. - PubMed

Associated data