. 2010 Oct;59(10):2444-52.
doi: 10.2337/db10-0174. Epub 2010 Aug 3.

Increased reactive oxygen species production and lower abundance of complex I subunits and carnitine palmitoyltransferase 1B protein despite normal mitochondrial respiration in insulin-resistant human skeletal muscle

Affiliations

Increased reactive oxygen species production and lower abundance of complex I subunits and carnitine palmitoyltransferase 1B protein despite normal mitochondrial respiration in insulin-resistant human skeletal muscle

Natalie Lefort et al. Diabetes. 2010 Oct.

Abstract

Objective: The contribution of mitochondrial dysfunction to skeletal muscle insulin resistance remains elusive. Comparative proteomics are being applied to generate new hypotheses in human biology and were applied here to isolated mitochondria to identify novel changes in mitochondrial protein abundance present in insulin-resistant muscle.

Research design and methods: Mitochondria were isolated from vastus lateralis muscle from lean and insulin-sensitive individuals and from obese and insulin-resistant individuals who were otherwise healthy. Respiration and reactive oxygen species (ROS) production rates were measured in vitro. Relative abundances of proteins detected by mass spectrometry were determined using a normalized spectral abundance factor method.

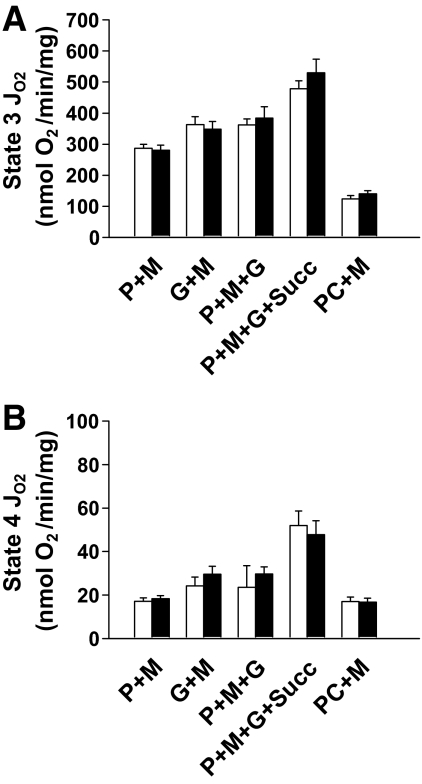
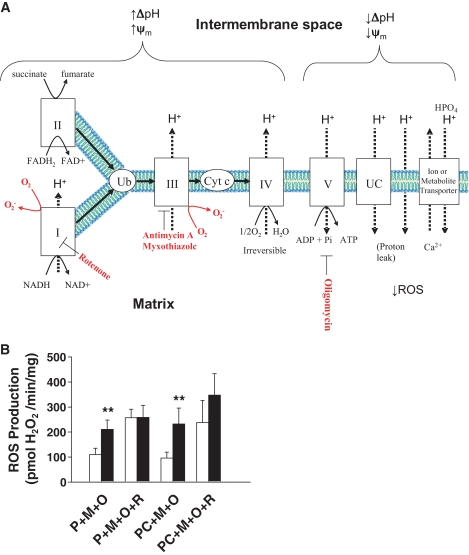
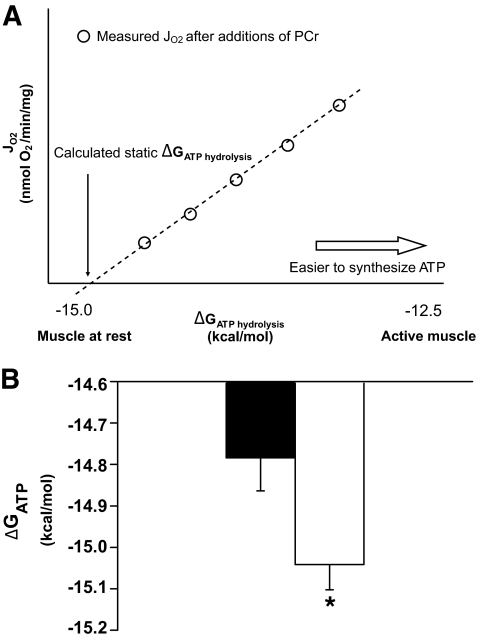
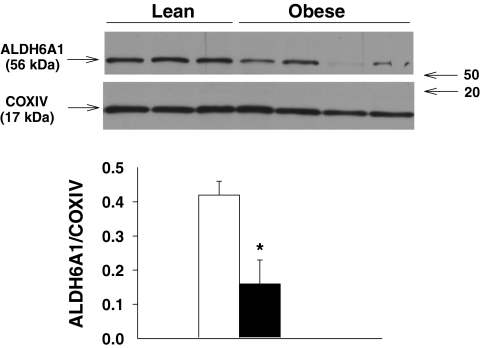
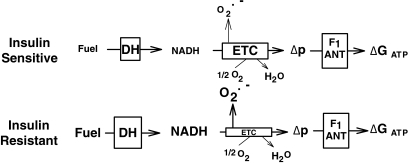
Results: NADH- and FADH(2)-linked maximal respiration rates were similar between lean and obese individuals. Rates of pyruvate and palmitoyl-DL-carnitine (both including malate) ROS production were significantly higher in obesity. Mitochondria from obese individuals maintained higher (more negative) extramitochondrial ATP free energy at low metabolic flux, suggesting that stronger mitochondrial thermodynamic driving forces may underlie the higher ROS production. Tandem mass spectrometry identified protein abundance differences per mitochondrial mass in insulin resistance, including lower abundance of complex I subunits and enzymes involved in the oxidation of branched-chain amino acids (BCAA) and fatty acids (e.g., carnitine palmitoyltransferase 1B).

Conclusions: We provide data suggesting normal oxidative capacity of mitochondria in insulin-resistant skeletal muscle in parallel with high rates of ROS production. Furthermore, we show specific abundance differences in proteins involved in fat and BCAA oxidation that might contribute to the accumulation of lipid and BCAA frequently associated with the pathogenesis of insulin resistance.


Figures

FIG. 1.
FIG. 1.
In vitro oxidative capacity of isolated mitochondria. Mitochondrial fractions were rapidly isolated from basal vastus lateralis biopsies (□, lean insulin-sensitive participants; ■, obese insulin-resistant participants). A: State 3 respiration rate was measured in response to 0.5 mmol/l ADP. B: State 4 respiration rate was measured following the consumption of 0.5 mmol/l ADP. (See research design and methods for concentrations.) Data are presented as means ± SEM in units of nmol min−1 mg protein−1. Lean/obese n: pyruvate (P) plus malate (M), 18/12; palmitoyl-dl-carnitine (PC) plus malate, 16/10; pyruvate plus malate plus glutamate (G), 5/11; glutamate plus malate, 7/5; pyruvate plus malate plus glutamate plus succinate (Succ), 7/7.
FIG. 2.
FIG. 2.
In vitro ROS production rates. A: Diagram indicating the electron transport chain complexes along with their substrates (NADH, FADH2, ubiquinone, or cytochrome c) and the inhibitors that target them (red text: rotenone, antimycin A, myxothyazole, and oligomycin). Complexes I and III contain ROS-generating sites (red arrows). Black full arrows show the path of electron flow within the inner mitochondrial membrane (IMM), and black dashed arrows show the directional path of protons across the IMM. Electrons can flow from complex II to I (reverse electron flow) and produce ROS; rotenone blocks this flow from complex II. ROS production by complex I is enhanced in the presence of rotenone because rotenone's binding site is downstream of the ROS-producing site in this complex. B: ROS production rates were quantified by incubating isolated mitochondria (10 μg) with various substrate combinations, Amplex Red, and horseradish peroxidase (see research design and methods for detailed procedures). (□, lean insulin-sensitive participants; ■, obese insulin-resistant participants.) Data are presented as means ± SEM; n = 7 per substrate combination. **P < 0.05 vs. lean participants. G, glutamate; M, malate; O, 1 μg/ml oligomycin; P, pyruvate; PC, palmitoyl-dl-carnitine; R, 10 μmol/l rotenone; Succ, succinate.
FIG. 3.
FIG. 3.
Static head ΔGATP. Isolated mitochondria were challenged with pyruvate plus malate at different PCr-to-Cr ratios. A: schematic representation of the Jo2 vs. ΔGATP plot. B: The static head ΔGATP was calculated by extrapolating the curve of the Jo2 vs. ΔGATP curve to Jo2 = 0. (□, lean insulin-sensitive participants; ■, obese insulin-resistant participants.) Data are presented as means ± SEM; n = 7 per group. Student's t test was performed. *P < 0.01 vs. lean participants.
FIG. 4.
FIG. 4.
Comparison of protein abundances determined by mass spectrometry to immunoblotting. Mitochondrial lysates (20 μg) (n = 3–4) were probed for ALDH6A1 and COXIV abundances. ALDH6A1 abundance was normalized to a loading control (COXIV). (□, lean insulin-sensitive participants; ■, obese insulin-resistant participants.) *P = 0.06.
FIG. 5.
FIG. 5.
Proposed bioenergetic model occurring in skeletal muscle insulin resistance. In insulin-resistant skeletal muscle, high catalytic potential in the redox-producing block (i.e., NADH levels) owing to increased citric acid cycle dehydrogenase activity; (isocitrate dehydrogenase [when considering its three subunits] abundance is higher in mitochondria from insulin-resistant muscle [data not shown]) relative to the redox-utilizing block (i.e., ETC, which is particularly impaired by complex I in insulin resistance), which would lead to the following: 1) higher static head energy (at low flux, high-redox pressure developed by the dehydrogenase is kinetically allowed to achieve near equilibration with ATP energy downstream), 2) lower ΔGATP:Jo slope (the impediment to electron flow is exposed by relaxation of downstream ΔGATP energy and transition to higher flux), and 3) higher ROS production due to higher driving force (more negative redox potential of electron transfer centers). The protonmotive force (Δp) was not measured and was included for completeness of the model. No differences in the abundance of ATP synthase F1 component or the adenine nucleotide translocator (ANT) were observed in mitochondria from insulin-resistant muscle by mass spectrometry.

Similar articles

Cited by

References

    1. Szendroedi J, Roden M. Ectopic lipids and organ function. Curr Opin Lipidol 2009;20:50–56 - PubMed
    1. Vondra K, Rath R, Bass A, Slabochova Z, Teisinger J, Vitek V. Enzyme activities in quadriceps femoris muscle of obese diabetic male patients. Diabetologia 1977;13:527–529 - PubMed
    1. Morino K, Petersen KF, Dufour S, Befroy D, Frattini J, Shatzkes N, Neschen S, White MF, Bilz S, Sono S, Pypaert M, Shulman GI. Reduced mitochondrial density and increased IRS-1 serine phosphorylation in muscle of insulin-resistant offspring of type 2 diabetic parents. J Clin Invest 2005;115:3587–3593 - PMC - PubMed
    1. Kelley DE, He J, Menshikova EV, Ritov VB. Dysfunction of mitochondria in human skeletal muscle in type 2 diabetes. Diabetes 2002;51:2944–2950 - PubMed
    1. Ritov VB, Menshikova EV, He J, Ferrell RE, Goodpaster BH, Kelley DE. Deficiency of subsarcolemmal mitochondria in obesity and type 2 diabetes. Diabetes 2005;54:8–14 - PubMed

Publication types

MeSH terms