

Gene array and fluorescence in situ hybridization biomarkers of activity of saracatinib (AZD0530), a Src inhibitor, in a preclinical model of colorectal cancer
- PMID: 20682712
- PMCID: PMC3805460
- DOI: 10.1158/1078-0432.CCR-10-0066
Gene array and fluorescence in situ hybridization biomarkers of activity of saracatinib (AZD0530), a Src inhibitor, in a preclinical model of colorectal cancer
Abstract
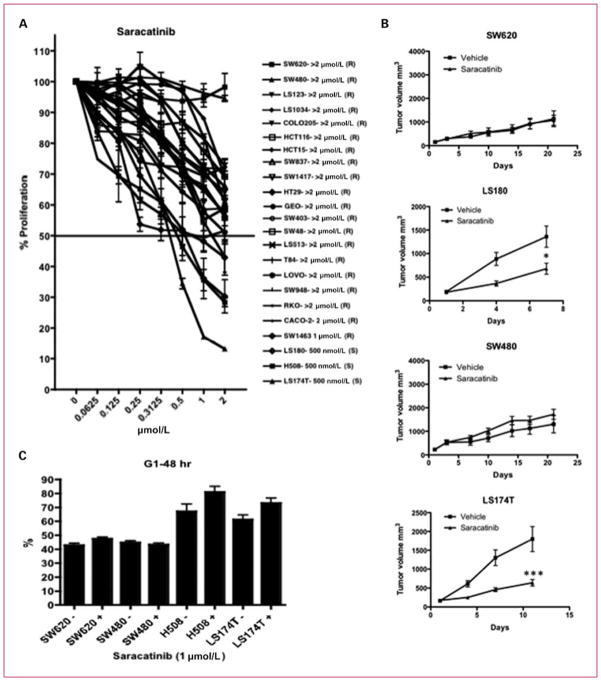
Purpose: To evaluate the efficacy of saracatinib (AZD0530), an oral Src inhibitor, in colorectal cancer (CRC) and to identify biomarkers that predict antitumor activity.
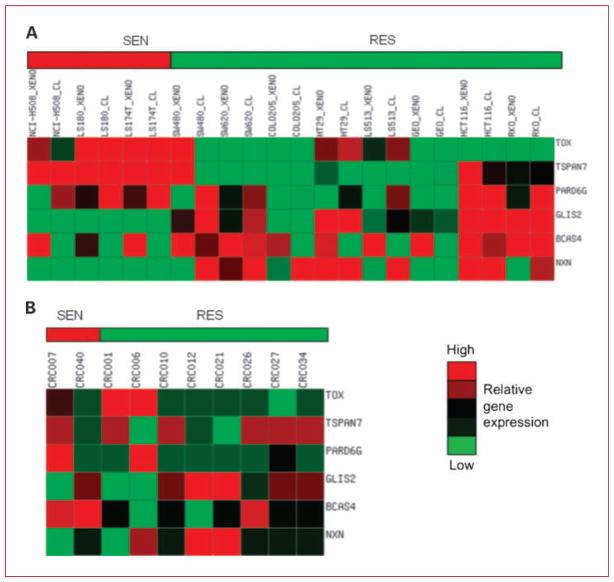
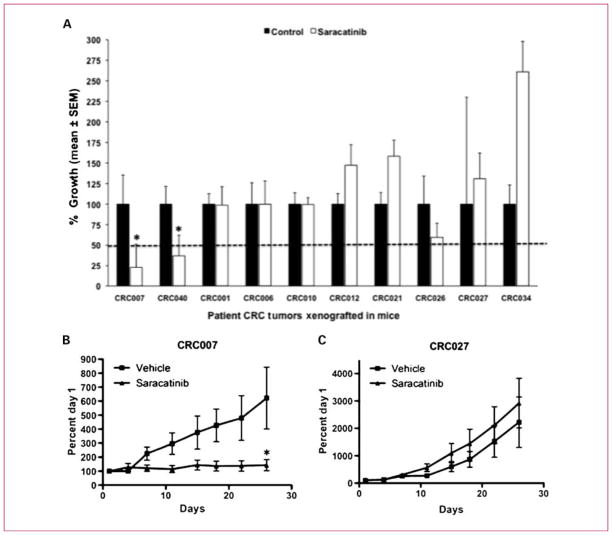
Experimental design: Twenty-three CRC cell lines were exposed to saracatinib, and baseline gene expression profiles of three sensitive and eight resistant cell lines in vitro and in vivo were used to predict saracatinib sensitivity in an independent group of 10 human CRC explant tumors using the gene array K-Top Scoring Pairs (K-TSP) method. In addition, fluorescence in situ hybridization (FISH) and immunoblotting determined both Src gene copy number and activation of Src, respectively.
Results: Two of 10 explant tumors were determined to be sensitive to saracatinib. The K-TSP classifier (TOX>GLIS2, TSPAN7>BCAS4, and PARD6G>NXN) achieved 70% (7 of 10) accuracy on the test set. Evaluation of Src gene copy number by FISH showed a trend toward significance (P = 0.066) with respect to an increase in Src gene copy and resistance to saracatinib. Tumors sensitive to saracatinib showed an increase in the activation of Src and FAK when compared with resistant tumors.
Conclusions: Saracatinib significantly decreased tumor growth in a subset of CRC cell lines and explants. A K-TSP classifier (TOX>GLIS2, TSPAN7>BCAS4, and PARD6G>NXN) was predictive for sensitivity to saracatinib. In addition, increased activation of the Src pathway was associated with sensitivity to saracatinib. These results suggest that FISH, a K-TSP classifier, and activation of the Src pathway have potential in identifying CRC patients that would potentially benefit from treatment with saracatinib.
Conflict of interest statement
J.J. Arcoli: advisory board for saracatinib, AstraZeneca. The other authors disclosed no potential conflicts of interest.
Figures


Similar articles
-
Antitumor effects and biomarkers of activity of AZD0530, a Src inhibitor, in pancreatic cancer.Clin Cancer Res. 2009 Jun 15;15(12):4138-46. doi: 10.1158/1078-0432.CCR-08-3021. Epub 2009 Jun 9. Clin Cancer Res. 2009. PMID: 19509160
-
Common PIK3CA mutants and a novel 3' UTR mutation are associated with increased sensitivity to saracatinib.Clin Cancer Res. 2012 May 1;18(9):2704-14. doi: 10.1158/1078-0432.CCR-11-3167. Clin Cancer Res. 2012. PMID: 22553375 Free PMC article.
-
Identification of predictive markers of response to the MEK1/2 inhibitor selumetinib (AZD6244) in K-ras-mutated colorectal cancer.Mol Cancer Ther. 2010 Dec;9(12):3351-62. doi: 10.1158/1535-7163.MCT-10-0376. Epub 2010 Oct 5. Mol Cancer Ther. 2010. PMID: 20923857 Free PMC article.
-
Combined Src and ER blockade impairs human breast cancer proliferation in vitro and in vivo.Breast Cancer Res Treat. 2011 Jul;128(1):69-78. doi: 10.1007/s10549-010-1024-7. Epub 2010 Jul 29. Breast Cancer Res Treat. 2011. PMID: 20669046
-
Dual Drug Repurposing: The Example of Saracatinib.Int J Mol Sci. 2024 Apr 22;25(8):4565. doi: 10.3390/ijms25084565. Int J Mol Sci. 2024. PMID: 38674150 Free PMC article. Review.
Cited by
-
Integrative and Comprehensive Pan-Cancer Analysis of Lymphocyte-Specific Protein Tyrosine Kinase in Human Tumors.Int J Mol Sci. 2022 Nov 13;23(22):13998. doi: 10.3390/ijms232213998. Int J Mol Sci. 2022. PMID: 36430477 Free PMC article.
-
Hematopoietic cell kinase (HCK) as a therapeutic target in immune and cancer cells.Oncotarget. 2015 Jun 30;6(18):15752-71. doi: 10.18632/oncotarget.4199. Oncotarget. 2015. PMID: 26087188 Free PMC article. Review.
-
Evaluation of the efficacy of dasatinib, a Src/Abl inhibitor, in colorectal cancer cell lines and explant mouse model.PLoS One. 2017 Nov 1;12(11):e0187173. doi: 10.1371/journal.pone.0187173. eCollection 2017. PLoS One. 2017. PMID: 29091939 Free PMC article.
-
Targeting metastasis.Nat Rev Cancer. 2016 Apr;16(4):201-18. doi: 10.1038/nrc.2016.25. Nat Rev Cancer. 2016. PMID: 27009393 Free PMC article. Review.
-
Patient-derived tumour xenografts as models for oncology drug development.Nat Rev Clin Oncol. 2012 Apr 17;9(6):338-50. doi: 10.1038/nrclinonc.2012.61. Nat Rev Clin Oncol. 2012. PMID: 22508028 Free PMC article. Review.
References
-
- Bromann PA, Korkaya H, Courtneidge SA. The interplay between Src family kinases and receptor tyrosine kinases. Oncogene. 2004;23:7957–68. - PubMed
-
- Frame MC. Src in cancer: deregulation and consequences for cell behaviour. Biochim Biophys Acta. 2002;1602:114–30. - PubMed
-
- Schlessinger J. New roles for Src kinases in control of cell survival and angiogenesis. Cell. 2000;100:293–6. - PubMed
-
- Summy J, Gallick G. Src family kinases in tumor progression and metastasis. Cancer Metastasis Rev. 2003;22:337–58. - PubMed
MeSH terms
Substances
Grants and funding
LinkOut - more resources
Full Text Sources
Other Literature Sources
Medical
Miscellaneous
