. 2010 Aug 17;107(33):14857-62.
doi: 10.1073/pnas.1009532107. Epub 2010 Aug 3.

T-type channels control the opioidergic descending analgesia at the low threshold-spiking GABAergic neurons in the periaqueductal gray

Affiliations

T-type channels control the opioidergic descending analgesia at the low threshold-spiking GABAergic neurons in the periaqueductal gray

Cheongdahm Park et al. Proc Natl Acad Sci U S A. .

Abstract

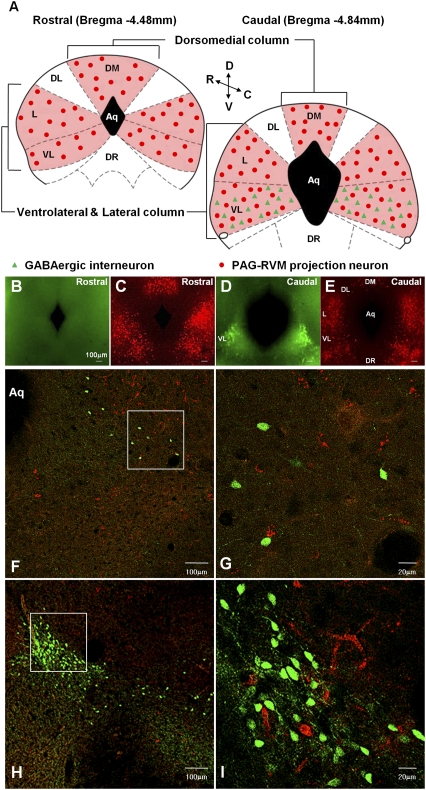
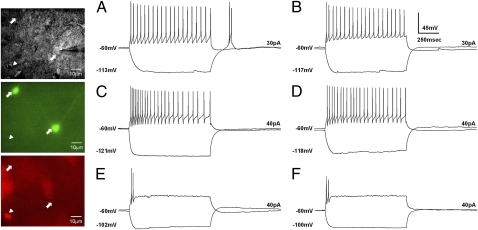
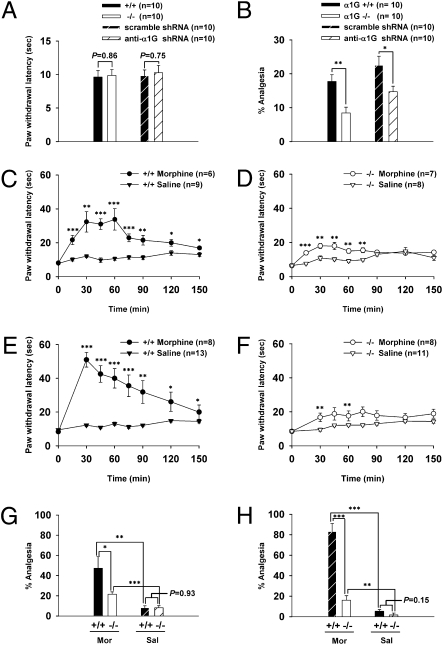
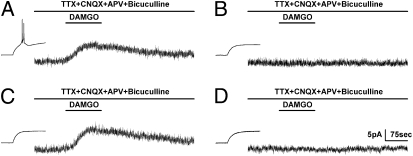
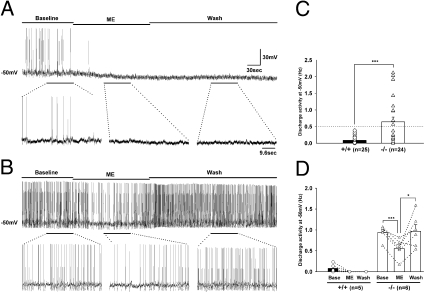
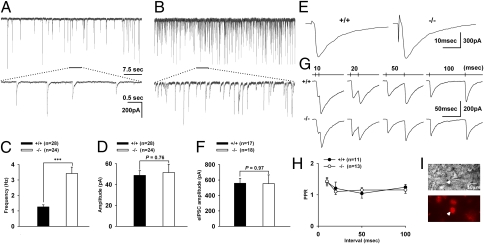
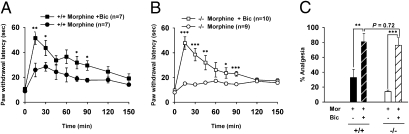
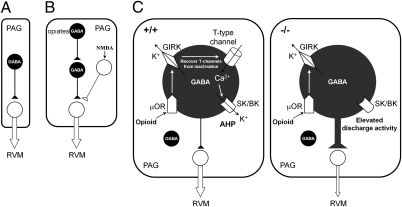
Endogenous opioids generate analgesic signals in the periaqueductal gray (PAG). However, because cell types in the PAG are difficult to identify, its neuronal mechanism has remained poorly understood. To address this issue, we characterized PAG neurons by their electrical properties using differentially labeled GABAergic and output neurons in the PAG. We found that GABAergic neurons were mostly fast-spiking cells and could be further divided into two distinct classes: with or without low-threshold spikes (LTS) driven by T-type channels. In contrast, the PAG output neurons lacked LTS and showed heterogeneous firing patterns. To reveal the function of the LTS, we examined the mutant mice lacking the alpha1G T-type channels (alpha1G(-/-)). The mutant mice lacked LTS in the fast-spiking GABAergic neurons of the PAG and unexpectedly showed impaired opioid-dependent analgesia; a similar phenotype was reproduced in PAG-specific alpha1G-knockdown mice. Electrophysiological analyses revealed functional expression of mu-opioid receptors in the low threshold-spiking GABAergic neurons. These neurons in the mutant lacking LTS showed markedly enhanced discharge activities, which led to an augmented inhibition of output neurons. Furthermore, the impaired analgesia observed in alpha1G(-/-) mice was reversed by blocking local GABA(A) receptors. These results indicate that alpha1G T-type channels are critical for the opioidergic descending analgesia system in the PAG.


Conflict of interest statement

The authors declare no conflict of interest.

Figures

Fig. 1.
Fig. 1.
The localized GABAergic neurons in the caudal part of the VL column and the distinct longitudinal columns of PAG-RVM projection neurons in the mouse PAG. (A) The cartoons illustrate the distribution of the GABAergic neurons and PAG-RVM projection neurons in the mouse PAG. The colored areas indicate the position of PAG-RVM projecting columns. (B–E) The sections of the PAG are presented with epifluorescence using a GFP (B and D) and a rhodamin (C and E) filter. (F–I) Confocal imaging. (F and H) The GABAergic neurons in the VL column are localized only in the caudal portion (F) and become denser up to the end of the caudal portion (H). (G and I) The enlarged view in Inset in F and H is shown in G and I, respectively. Green, the GFP on GABAergic neurons; red, the retrograde dye on PAG-RVM projection neurons.
Fig. 2.
Fig. 2.
Electrophysiologically distinct classes of GABAergic neurons and PAG-RVM projection neurons in the vlPAG. The panel displays differential interference contrast (DIC) images (Top), GFP images (Middle), and retrograde-dye images (Bottom) of the patched neurons. Arrows indicate examples of GABAergic neurons, and the arrowhead indicates a PAG-RVM projection neuron. Two response patterns by either negative or positive step-current input are superposed in the traces. (A and B). GABAergic neurons. (A) Wild-type LTS-positive FS cells. (B) α1G−/− LTS-negative FS cell. (C–F) PAG-RVM projection neurons. (C) Wild-type FS cells. (D) α1G−/− FS cells. (E) Wild-type TS cells. (F) α1G−/− TS cells. The changes in the membrane potential and the applied currents are indicated in each trace.
Fig. 3.
Fig. 3.
The impaired analgesia in α1G−/− and PAG-specific α1G-knockdown mice. (A and B) Bar graphs for the effects of α1G T-type channels in pain sensation. The wild-type and α1G−/− mice as well as the scrambled shRNA and shRNA-α1G mice showed similar basal thermal sensitivity (A). The SSIA was impaired in α1G−/− (17.71% ± 1.98% and 8.44% ± 1.74% analgesia for wild-type and mutant mice, respectively) and α1G-knockdown mice (22.48% ± 2.68% and 14.70% ± 1.66% analgesia for scrambled and shRNA-α1G mice, respectively) (B). (C–F) Time course for the effects of morphine or saline at the systemic level (C and D) and the PAG level (E and F). (G and H) The percent analgesia at 60 min postinfusion from C and D are shown in G, whereas those at 30 min postinfusion from E and F are shown in H.
Fig. 4.
Fig. 4.
The selective induction of LTS in μOR-positive FS GABAergic neurons of the vlPAG. The addition of drugs is indicated on top of each trace. (A and B) Wild-type FS GABAergic neurons. The LTS-positive GABAergic neurons expressed DAMGO-induced outward currents (A); none of the LTS-negative neurons showed a response to DAMGO (B). (C and D) α1G−/− FS GABAergic neurons, both without LTS. The frequency of DAMGO-responding (C) and -nonresponding (D) neurons among α1G−/− FS GABAergic neurons was similar to that in the wild-type. Vh, −50 mV.
Fig. 5.
Fig. 5.
Discharge activities at a depolarized membrane potential in the μOR-positive GABAergic neurons of the vlPAG. (A and B) Firing-pattern changes for three periods from (A) the wild-type LTS-positive μOR-positive and (B) α1G−/− LTS-negative μOR-positive GABAergic neurons are shown. The portions of the traces underlined by horizontal bars in A and B were analyzed and presented in D. The same portions of the traces are illustrated with an expanded time scale below each trace. (C) The bar graph illustrates the basal-discharge activities of wild-type (0.09 ± 0.02 Hz) and α1G−/− (0.64 ± 0.14 Hz) neurons. (D) Changes of discharge activity (A and B) in the wild-type (basal: 0.08 ± 0.05 Hz; ME: 0 Hz; Wash: 0 Hz) and α1G−/− (basal: 0.942 ± 0.07 Hz; ME: 0.56 ± 0.09 Hz; Wash: 0.97 ± 0.16 Hz) neurons. Wild type vs. α1G−/−: F1,9 = 66.536, P < 0.001, RM ANOVA. Paired t test (*P < 0.05; ***P < 0.001).
Fig. 6.
Fig. 6.
Characterization of GABAergic sIPSC, eIPSC, and PPR of PAG-RVM projection neurons. (A and B) Examples of sIPSCs recorded in the wild-type (A) and α1G−/− (B) projection neurons. Horizontal bars indicate the trace portions that were illustrated with an expanded time scale beneath. (C) The bar graph illustrates the frequency of sIPSC in the wild-type (1.26 ± 0.13 Hz) and α1G−/− projection (3.42 ± 0.42 Hz) neurons. The frequency of sIPSC was increased in α1G−/− without changes in the amplitude (48.84 ± 4.45 pA and 51.51 ± 7.98 pA for wild-type and α1G−/−, respectively) (D). (E) Representative traces showing the eIPSC in the wild-type (Left) and α1G−/− (Right) projection neurons. (F) The peak amplitude of eIPSC in the wild-type (558.65 ± 61.94 pA) and α1G−/− projection (553.83 ± 112.34 pA) neurons showed no difference. (G) Paired-pulse stimulations elicited eIPSCs that show PPF in wild-type (Upper) and α1G−/− projection (Lower) neurons. The interstimulus intervals are indicated on the top of the traces. (H) The PPR was not significantly different between the two genotypes. (I) The DIC image (Top) and retrograde dye image (Bottom) of a patched neuron. Arrowheads indicate a projection neuron.
Fig. 7.
Fig. 7.
The reversed opioidergic analgesia by antagonizing local GABAA receptors in the vlPAG of α1G−/− mice. (AC) The analgesic effects of morphine with or without bicuculline in the vlPAG of wild-type (A) and mutant mice (B). In mutant mice, the mixture induced a nearly complete restoration of analgesia to the wild-type levels. RM ANOVA and posthoc Tukey test. (C) The percent analgesia at 15 min postinfusion from A and B.
Fig. 8.
Fig. 8.
The redefined disinhibition model for the opioid analgesic circuitry in the PAG. (A and B) The disinhibition model in the PAG was proposed by Basbaum and Fields in 1984 (A) and Jacquet in 1988 (B). (C) The redefined disinhibition model proposed here in wild-type (Left) and α1G−/− mice (Right); it was reproduced in PAG-specific α1G-knockdown mice. •, GABAergic neuron; ○, non-GABAergic neuron; ▲, inhibitory; △, excitatory function; ↑, flow of chemicals; ⇓, the excitatory transmission pathways of the PAG-RVM projection neurons. The thickness of the line indicates relative activity of the individual transmission pathway.

Similar articles

Cited by

References

    1. Yaksh TL, Yeung JC, Rudy TA. Systematic examination in the rat of brain sites sensitive to the direct application of morphine: Observation of differential effects within the periaqueductal gray. Brain Res. 1976;114:83–103. - PubMed
    1. Reichling DB, Kwiat GC, Basbaum AI. Anatomy, physiology and pharmacology of the periaqueductal gray contribution to antinociceptive controls. Prog Brain Res. 1988;77:31–46. - PubMed
    1. Dostrovsky JO, Deakin JFW. Periaqueductal grey lesions reduce morphine analgesia in the rat. Neurosci Lett. 1977;4:99–103. - PubMed
    1. Lewis VA, Gebhart GF. Evaluation of the periaqueductal central gray (PAG) as a morphine-specific locus of action and examination of morphine-induced and stimulation-produced analgesia at coincident PAG loci. Brain Res. 1977;124:283–303. - PubMed
    1. Basbaum AI, Fields HL. Endogenous pain control systems: Brainstem spinal pathways and endorphin circuitry. Annu Rev Neurosci. 1984;7:309–338. - PubMed

Publication types

MeSH terms

LinkOut - more resources