

Toward next generation plasma profiling via heat-induced epitope retrieval and array-based assays
- PMID: 20682762
- PMCID: PMC2984230
- DOI: 10.1074/mcp.M110.001560
Toward next generation plasma profiling via heat-induced epitope retrieval and array-based assays
Abstract
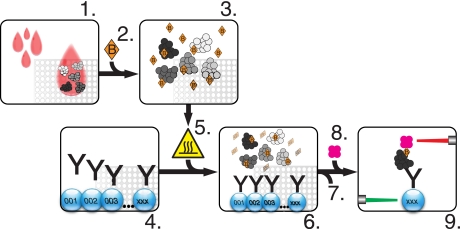
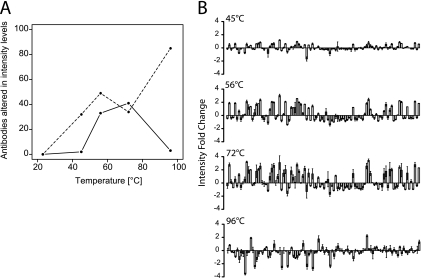
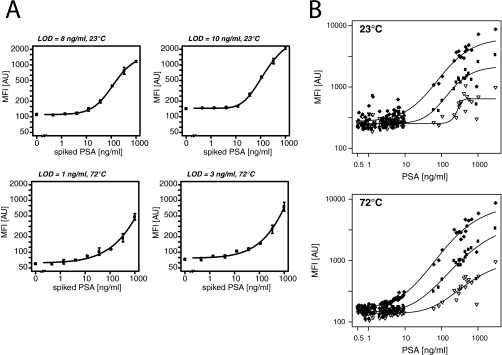
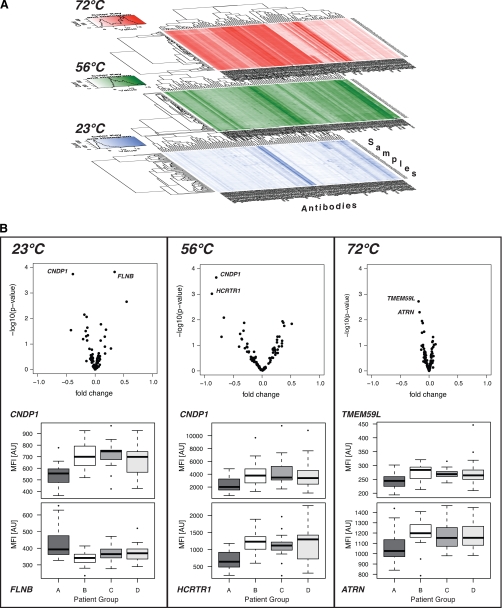
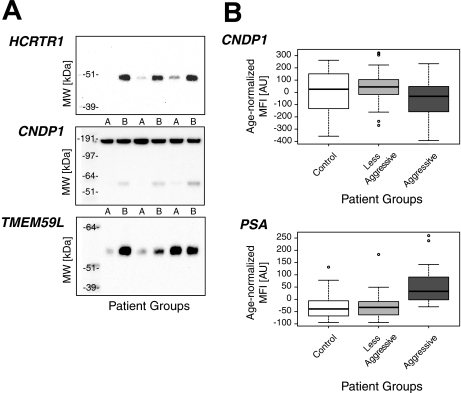
There is a need for high throughput methods for screening patient samples in the quest for potential biomarkers for diagnostics and patient care. Here, we used a combination of undirected target selection, antibody suspension bead arrays, and heat-induced epitope retrieval to allow for protein profiling of human plasma in a novel and systematic manner. Several antibodies were found to reveal altered protein profiles upon epitope retrieval at elevated temperatures with limits of detection improving into lower ng/ml ranges. In a study based on prostate cancer patients, several proteins with differential profiles were discovered and subsequently validated in an independent cohort. For one of the potential biomarkers, the human carnosine dipeptidase 1 protein (CNDP1), the differences were determined to be related to the glycosylation status of the targeted protein. The study shows a path of pursuit for large scale screening of biobank repositories in a flexible and proteome-wide fashion by utilizing heat-induced epitope retrieval and using an antibody suspension bead array format.
Figures
Similar articles
-
Highly multiplexed antibody suspension bead arrays for plasma protein profiling.Methods Mol Biol. 2013;1023:137-45. doi: 10.1007/978-1-4614-7209-4_8. Methods Mol Biol. 2013. PMID: 23765623
-
Profiling post-centrifugation delay of serum and plasma with antibody bead arrays.J Proteomics. 2013 Dec 16;95:46-54. doi: 10.1016/j.jprot.2013.04.020. Epub 2013 Apr 28. J Proteomics. 2013. PMID: 23631827 Clinical Trial.
-
Comparative protein profiling of serum and plasma using an antibody suspension bead array approach.Proteomics. 2010 Feb;10(3):532-40. doi: 10.1002/pmic.200900657. Proteomics. 2010. PMID: 19953555
-
Emerging Affinity-Based Proteomic Technologies for Large-Scale Plasma Profiling in Cardiovascular Disease.Circulation. 2017 Apr 25;135(17):1651-1664. doi: 10.1161/CIRCULATIONAHA.116.025446. Circulation. 2017. PMID: 28438806 Free PMC article. Review.
-
Autoantigen Microarray for High-throughput Autoantibody Profiling in Systemic Lupus Erythematosus.Genomics Proteomics Bioinformatics. 2015 Aug;13(4):210-8. doi: 10.1016/j.gpb.2015.09.001. Epub 2015 Sep 28. Genomics Proteomics Bioinformatics. 2015. PMID: 26415621 Free PMC article. Review.
Cited by
-
ProteinSeq: high-performance proteomic analyses by proximity ligation and next generation sequencing.PLoS One. 2011;6(9):e25583. doi: 10.1371/journal.pone.0025583. Epub 2011 Sep 29. PLoS One. 2011. PMID: 21980495 Free PMC article.
-
Multiplexed protein profiling by sequential affinity capture.Proteomics. 2016 Apr;16(8):1251-6. doi: 10.1002/pmic.201500398. Epub 2016 Mar 31. Proteomics. 2016. PMID: 26935855 Free PMC article.
-
Serum Proteomic Profiling in Rheumatoid Arthritis by Antibody Suspension Bead Arrays.Methods Mol Biol. 2021;2259:143-151. doi: 10.1007/978-1-0716-1178-4_8. Methods Mol Biol. 2021. PMID: 33687712
-
A panel of CSF proteins separates genetic frontotemporal dementia from presymptomatic mutation carriers: a GENFI study.Mol Neurodegener. 2021 Nov 27;16(1):79. doi: 10.1186/s13024-021-00499-4. Mol Neurodegener. 2021. PMID: 34838088 Free PMC article.
-
Generation of monospecific antibodies based on affinity capture of polyclonal antibodies.Protein Sci. 2011 Nov;20(11):1824-35. doi: 10.1002/pro.716. Epub 2011 Oct 12. Protein Sci. 2011. PMID: 21898641 Free PMC article.
References
-
- Hanash S. (2003) Disease proteomics. Nature 422, 226–232 - PubMed
-
- Ludwig J. A., Weinstein J. N. (2005) Biomarkers in cancer staging, prognosis and treatment selection. Nat. Rev. Cancer 5, 845–856 - PubMed
-
- Hanash S. M., Pitteri S. J., Faca V. M. (2008) Mining the plasma proteome for cancer biomarkers. Nature 452, 571–579 - PubMed
-
- Cox J., Mann M. (2007) Is proteomics the new genomics? Cell 130, 395–398 - PubMed
-
- Wu S. L., Kim J., Bandle R. W., Liotta L., Petricoin E., Karger B. L. (2006) Dynamic profiling of the post-translational modifications and interaction partners of epidermal growth factor receptor signaling after stimulation by epidermal growth factor using Extended Range Proteomic Analysis (ERPA). Mol. Cell. Proteomics 5, 1610–1627 - PubMed
Publication types
MeSH terms
Substances
LinkOut - more resources
Full Text Sources
Other Literature Sources
Miscellaneous
