. 2010 Oct 8;285(41):31661-71.
doi: 10.1074/jbc.M110.145037. Epub 2010 Aug 3.

Polarization and migration of hematopoietic stem and progenitor cells rely on the RhoA/ROCK I pathway and an active reorganization of the microtubule network

Affiliations

Polarization and migration of hematopoietic stem and progenitor cells rely on the RhoA/ROCK I pathway and an active reorganization of the microtubule network

Ana-Violeta Fonseca et al. J Biol Chem. .

Abstract

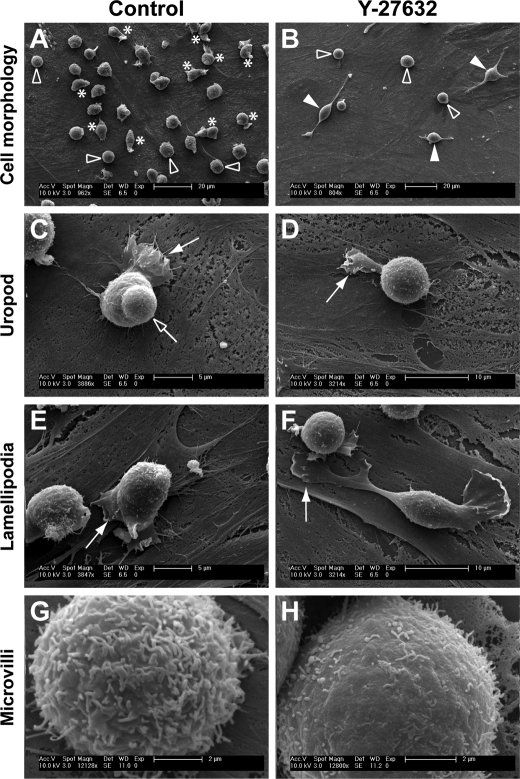
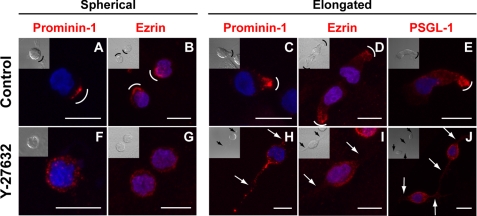
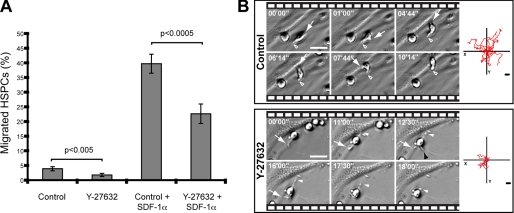
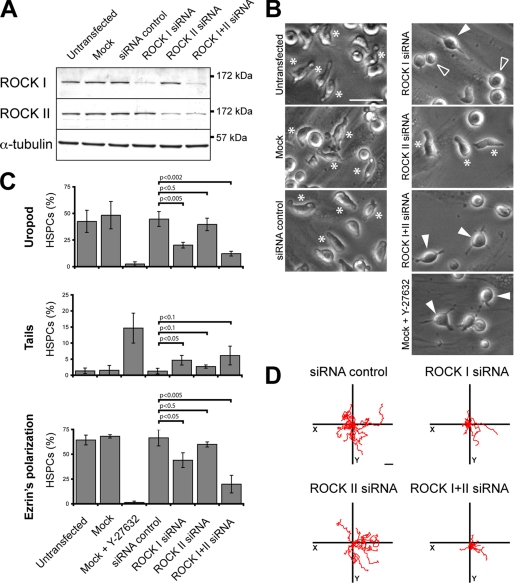
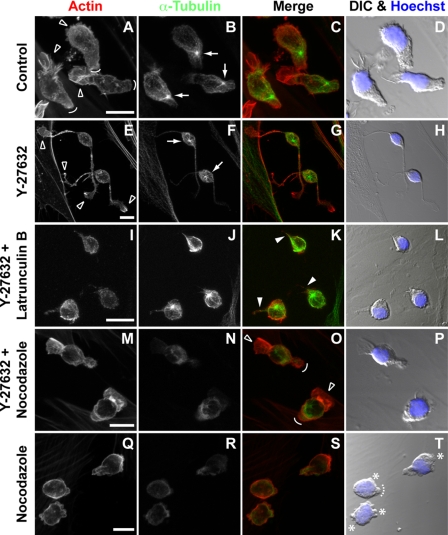
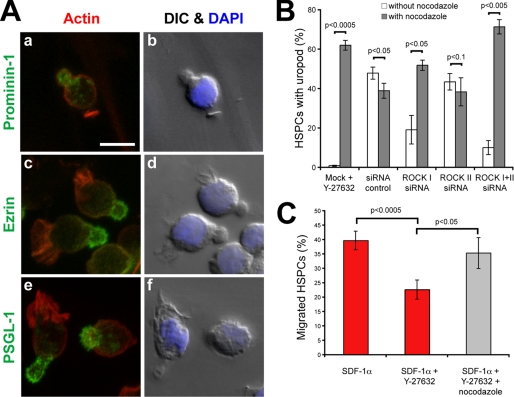
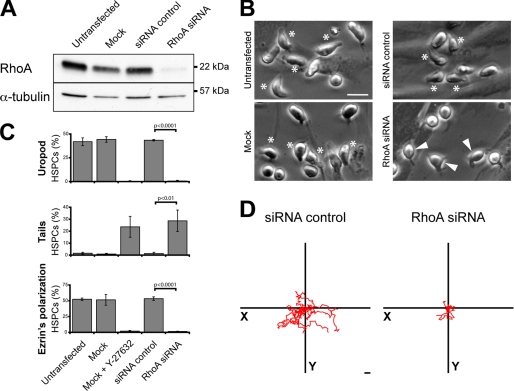
Understanding the physiological migration of hematopoietic progenitors is important, not only for basic stem cell research, but also in view of their therapeutic relevance. Here, we investigated the role of the Rho kinase pathway in the morphology and migration of hematopoietic progenitors using an ex vivo co-culture consisting of human primary CD34(+) progenitors and mesenchymal stromal cells. The addition of the Rho kinase inhibitor Y-27632 led to the abolishment of the uropod and microvillar-like structures of hematopoietic progenitors, concomitant with a redistribution of proteins found therein (prominin-1 and ezrin). Y-27632-treated cells displayed a deficiency in migration. Time-lapse video microscopy revealed impairment of the rear pole retraction. Interestingly, the knockdown of ROCK I, but not ROCK II, using RNA interference (RNAi) was sufficient to cause the referred morphological and migrational changes. Unexpectedly, the addition of nocodazole to either Y-27632- or ROCK I RNAi-treated cells could restore their polarized morphology and migration suggesting an active role for the microtubule network in tail retraction. Finally, we could demonstrate using RNAi that RhoA, the upstream regulator of ROCK, is involved in these processes. Collectively, our data provide new insights regarding the role of RhoA/ROCK I and the microtubules in the migration of stem cells.


Figures

FIGURE 1.
FIGURE 1.
ROCK inhibitor Y-27632 alters the morphology of hematopoietic progenitors. HSPCs cultured on MSCs for 7 days in the absence (A, C, E, and G) or presence (B, D, F, and H) of Y-27632 were analyzed by scanning electron microscopy. A and B, untreated HSPCs (Control) can either be spherical (outlined arrowhead) or polarized (asterisk) with a uropod and/or lamellipodium (A), whereas Y-27632-treated HSPCs are mostly round (outlined arrowhead) or have one to three long and thin plasma membrane protrusions (filled arrowhead) (B). C–F, polarized HSPCs exhibit a uropod at the rear pole (C, outlined arrow), whereas most Y-27632-treated HSPCs do not (D). Y-27632-treated HSPCs have a narrower lamellipodium (D, filled arrow) in comparison to untreated cells (C and E, filled arrow). Large lamellipodia at the edge of thin protrusions are often observed in Y-27632-treated HSPCs (F, filled arrow). G and H, the surface of rounded HSPCs exhibits numerous microvillar-like structures (G) that are sensitive to the ROCK inhibitor (H).
FIGURE 2.
FIGURE 2.
Redistribution of membrane and cytoplasmic proteins upon treatment of hematopoietic progenitors with the ROCK inhibitor Y-27632. HSPCs cultured on MSCs for 3 days in the absence (A–E) or presence (F–J) of Y-27632 were analyzed by indirect immunofluorescence either by cell surface labeling (A, C, F, and H) or upon permeabilization (B, D, E, G, I, and J). HSPCs exhibiting either a spherical (A, B, F, and G) or elongated (C–E and H–J) morphology are depicted. A–E, the distribution of prominin-1, ezrin and PSGL-1 (all in red) is polarized in untreated HSPCs (A and C, prominin-1; B and D, ezrin; and E, PSGL-1). F–J, in the presence of Y-27632, prominin-1 (F and H), ezrin (G and I), and PSGL-1 (J) are redistributed over the entire plasma membrane or cytoplasm. A differential interference contrast image is shown in the inset. Nuclei were visualized with DAPI (blue). Curved lines indicate the clustering of either prominin-1, ezrin, or PSGL-1; arrows point to the long and thin plasma membrane protrusions observed in Y-27632-treated cells. Scale bars, 10 μm.
FIGURE 3.
FIGURE 3.
ROCK inhibitor Y-27632 alters the migration of hematopoietic progenitors. A, Transwell assay of untreated (Control) or Y-27632-treated HSPCs in the absence or presence of SDF-1α. The number of hematopoietic cells that migrated from the upper to the lower chamber after 1-h incubation is plotted as a percentage of total cells loaded (12.5 × 10⁴). Statistical analysis: t test. B, time-lapse video analysis of the migration of HSPCs. The arrow indicates the migrating front, whereas the outlined and filled white arrowheads point to the rear pole of HSPC present in the control or Y-27632-treated sample, respectively; the black arrowhead shows a third plasma membrane protrusion growing out from an Y-27632-treated HSPC. The elapsed time is shown in the upper left corner of each frame. Diagrams in the right panel depict the movement of 10 individual HSPCs for a period of 90 min. Scale bars, 15 μm.
FIGURE 4.
FIGURE 4.
ROCK I, but not ROCK II, is essential for the polarization and migration of hematopoietic progenitors. A–D, HSPCs were either untransfected or transfected with the indicated siRNA or without (Mock) prior to cultivation on MSCs for 2 days. A, ROCK I and II knockdowns were confirmed by immunoblotting of the total proteins extracted from the different transfectants. α-Tubulin was used as a control for the protein loading. B, HSPC morphology was analyzed by bright field microscopy. Asterisks indicate HSPCs with a uropod; filled arrowheads indicate HSPCs bearing long and thin plasma membrane protrusions; outlined arrowheads point cells with a spherical morphology. C, quantitative analysis of the HSPCs harboring either a uropod (upper panel) or a long plasma membrane protrusion as a trailing tail (middle panel) in the different transfectants. The polarization of ezrin (evaluated by fluorescence microscopy) in different transfectants is shown in the lower panel. The data are expressed as percentage of total HSPCs (200 cells were counted per condition; n = 3). Statistical analysis: t test. D, tracking diagrams based on time-lapse videos depict the movement of ten individual HSPCs for a period of 50 min. Scale bars, 20 μm.
FIGURE 5.
FIGURE 5.
The microtubule network is involved in the tail retraction of migrating hematopoietic progenitors. A–T, HSPCs cultured on MSCs were subjected to different treatments as indicated, prior to actin (red) and α-tubulin (green) fluorescence labeling and confocal microscopy analysis. Composites of 7–10 x-z optical sections are shown. Nuclei were visualized by Hoechst labeling (blue). Differential interference contrast (DIC) images are shown (D, H, L, P, and T). A–D, untreated HSPCs (Control); outlined arrowheads point the lamellipodium (migrating front), whereas curved lines indicate the uropod (rear pole of migrating cells). Arrows show the position of the centrosome. E–H, Y-27632-treated HSPCs; outlined arrowheads indicate lamellipodia at the edge of the long and thin plasma membrane protrusions induced by Y-27632 treatment, and arrows show the position of the centrosome. I–L, depolymerization of actin filaments with latrunculin B in Y-27632-treated HSPCs; filled arrowheads indicate reminiscent tails. M–P, depolymerization of microtubules with nocodazole in Y-27632-treated HSPCs; outlined arrowheads and curved lines indicate the restored lamellipodium and the uropod-like structure, respectively. Q–T, depolymerization of microtubules with nocodazole in HSPCs; asterisks indicate bleb-like membrane protrusions, whereas the dashed curved line shows a remnant of a uropod. Scale bars, 10 μm.
FIGURE 6.
FIGURE 6.
Microtubule depolymerization restores the polarization and migration of Y-27632-treated hematopoietic progenitors. A, nocodazole/Y-27632-treated HSPCs cultured on MSCs for 3 days were analyzed by indirect immunofluorescence upon permeabilization for prominin-1 (a, green), ezrin (c, green), and PSGL-1 (e, green). Actin (a, c, and e; red) and nuclei (b, d, and f; blue) were visualized with Phalloidin and DAPI labeling, respectively. Differential interference contrast (DIC) images are shown (b, d, and f). Scale bar, 10 μm. B, depolymerization of microtubules with nocodazole restores the uropod formation in ROCK I and ROCK I + II siRNA-transfected HSPCs. Number of uropods was determined via phase-contrast microscopy (200 cells were counted per condition; n = 3). Note that in the nocodazole-treated siRNA control and ROCK II siRNA samples only a remnant of uropod was observed (see also Fig. 5T). C, Transwell assay of nocodazole/Y-27632-treated HSPCs in the presence of SDF-1α. Number of hematopoietic progenitors that migrated from the upper to the lower chamber after 1 h is plotted as a percentage of total cells loaded (12.5 × 10⁴). (For comparison purposes, data shown in Fig. 3A are indicated in red, because all data were acquired in parallel.) Statistical analysis in B and C: t test.
FIGURE 7.
FIGURE 7.
RhoA controls the polarization and migration of hematopoietic progenitors. A–D, HSPCs were either untransfected or transfected with the indicated siRNA or without (Mock) prior to cultivation on MSCs. A, RhoA knockdown was confirmed by immunoblotting of the total protein extracted from the different transfectants. α-Tubulin was used as a control for the protein loading. B, HSPC morphology was analyzed by bright field microscopy. Asterisks and filled arrowheads indicate HSPCs bearing either a uropod or long and thin plasma membrane protrusions, respectively. C, quantitative analysis of the HSPCs harboring either a uropod (upper panel) or a long plasma membrane protrusion as a trailing tail (middle panel) in the different transfectants. The polarization of ezrin (evaluated by fluorescence microscopy) in different transfectants is shown in the lower panel. The data are expressed as the percentage of total HSPCs (200 cells were counted per condition; n = 3). Statistical analysis: t test. D, tracking diagrams based on time-lapse videos depict the movement of 10 individual HSPCs for a period of 50 min. Scale bars, 20 μm.

Similar articles

Cited by

References

    1. Wright D. E., Wagers A. J., Gulati A. P., Johnson F. L., Weissman I. L. (2001) Science 294, 1933–1936 - PubMed
    1. Giebel B., Corbeil D., Beckmann J., Höhn J., Freund D., Giesen K., Fischer J., Kögler G., Wernet P. (2004) Blood 104, 2332–2338 - PubMed
    1. Barreiro O., de la Fuente H., Mittelbrunn M., Sánchez-Madrid F. (2007) Immunol. Rev. 218, 147–164 - PubMed
    1. del Pozo M. A., Cabañas C., Montoya M. C., Ager A., Sánchez-Mateos P., Sánchez-Madrid F. (1997) J. Cell Biol. 137, 493–508 - PMC - PubMed
    1. Friedl P., Entschladen F., Conrad C., Niggemann B., Zänker K. S. (1998) Eur. J. Immunol. 28, 2331–2343 - PubMed

Publication types

MeSH terms