. 2010 Oct 8;285(41):31148-56.
doi: 10.1074/jbc.M110.132332. Epub 2010 Aug 3.

Growth hormone (GH)-dependent expression of a natural antisense transcript induces zinc finger E-box-binding homeobox 2 (ZEB2) in the glomerular podocyte: a novel action of gh with implications for the pathogenesis of diabetic nephropathy

Affiliations

Growth hormone (GH)-dependent expression of a natural antisense transcript induces zinc finger E-box-binding homeobox 2 (ZEB2) in the glomerular podocyte: a novel action of gh with implications for the pathogenesis of diabetic nephropathy

P Anil Kumar et al. J Biol Chem. .

Abstract

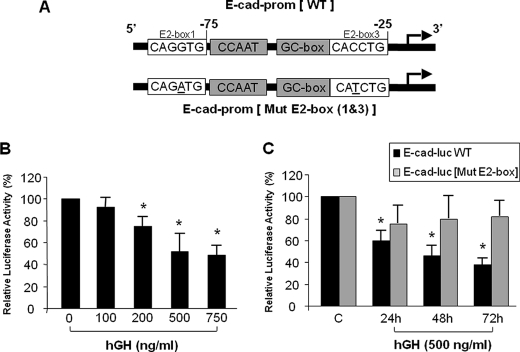
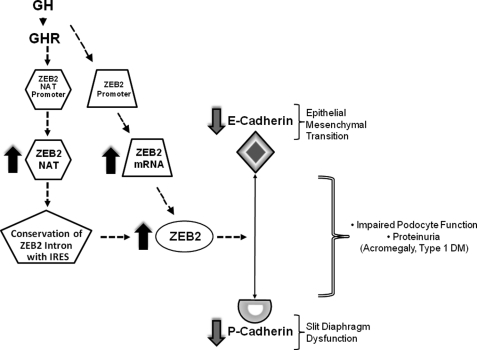
Growth hormone (GH) excess results in structural and functional changes in the kidney and is implicated as a causative factor in the development of diabetic nephropathy (DN). Glomerular podocytes are the major barrier to the filtration of serum proteins, and altered podocyte function and/or reduced podocyte number is a key event in the pathogenesis of DN. We have previously shown that podocytes are a target for GH action. To elucidate the molecular basis for the effects of GH on the podocyte, we conducted microarray and RT-quantitative PCR analyses of immortalized human podocytes and identified zinc finger E-box-binding homeobox 2 (ZEB2) to be up-regulated in a GH dose- and time-dependent manner. We established that the GH-dependent increase in ZEB2 levels is associated with increased transcription of a ZEB2 natural antisense transcript required for efficient translation of the ZEB2 transcript. GH down-regulated expression of E- and P-cadherins, targets of ZEB2, and inhibited E-cadherin promoter activity. Mutation of ZEB2 binding sites on the E-cadherin promoter abolished this effect of GH on the E-cadherin promoter. Whereas GH increased podocyte permeability to albumin in a paracellular albumin influx assay, shRNA-mediated knockdown of ZEB2 expression abrogated this effect. We conclude that GH increases expression of ZEB2 in part by increasing expression of a ZEB2 natural antisense transcript. GH-dependent increase in ZEB2 expression results in loss of P- and E-cadherins in podocytes and increased podocyte permeability to albumin. Decreased expression of P- and E-cadherins is implicated in podocyte dysfunction and epithelial-mesenchymal transition observed in DN. We speculate that the actions of GH on ZEB2 and P- and E-cadherin expression play a role in the pathogenesis of microalbuminuria of DN.


Figures

FIGURE 1.
FIGURE 1.
GH-dependent increase in ZEB2 expression in glomerular podocyte. A, immortalized differentiated human podocytes were exposed to hGH (500 ng/ml) for the indicated time periods as detailed under “Experimental Procedures.” The steady state abundance of the ZEB2 transcript was measured by RT-qPCR and is depicted relative to ZEB2 mRNA abundance prior to exposure to GH; GAPDH was used as an internal control. The results (n = 4–5) are depicted as mean ± S.E. *, p < 0.05 (Kruskal-Wallis test) compared with expression prior to exposure to GH. B, immortalized differentiated human podocytes were exposed to hGH (500 ng/ml) for the indicated time periods and subjected to Western blot analysis for ZEB2 and tubulin as detailed under “Experimental Procedures.” Results shown are representative of three independent experiments. C, immortalized differentiated human podocytes were exposed to the indicated concentrations of hGH for 48 h and subjected to Western blot analysis for ZEB2 and tubulin as detailed under “Experimental Procedures.” Results shown are representative of three independent experiments. D, HepG2 cells were transiently transfected with ZEB2 promoter-reporter luciferase construct as detailed under “Experimental Procedures.” Cotransfection of Renilla luciferase was used to normalize transfection efficiency. The normalized luciferase activity of the cell exposed to GH (gray bar) is depicted relative to activity of the cells exposed to vehicle alone (black bar) designated as 100%. Error bars indicate mean ± S.E.; n = 4. *, p < 0.05 compared with vehicle-treated cells. E, immortalized differentiated human podocytes were exposed to IGF-1 (200 ng/ml) for the indicated time periods and subjected to Western blot analysis for ZEB2 and tubulin as detailed under “Experimental Procedures.” Results shown are representative of two independent experiments.
FIGURE 2.
FIGURE 2.
GH-dependent increase in expression of natural antisense transcript of ZEB2. A, schematic depicting genomic organization of ZEB2 and origin of the ZEB2-NAT. The ZEB2 open reading frame (ORF) is depicted in black, the 5′-UTR intron is in white, the 5′-UTR and 3′-UTR exons are in gray, and the ZEB2 promoter is marked by downward diagonal stripes. The relative positions of the NAT, putative internal ribosome entry site (IRES), and the oligonucleotides used in the PCR analysis are also indicated. The numbering of the base pairs of the sequence depicted corresponds to NCBI Reference Sequence accession number NM014795.2. B, GH-dependent retention of the ZEB2 intron. Immortalized differentiated human podocytes were exposed to vehicle (CON) or hGH (500 ng/ml) for 36 h, and total RNA was isolated and reverse transcribed to cDNA as detailed under “Experimental Procedures.” The cDNA or mouse genomic DNA (as control) was used in PCR (left panel, 40 cycles; right panel, 25 and 35 cycles) using either 1F/2R (left panel) or 2F/2R (right panel) primers, and the amplified product was size-fractionated via agarose electrophoresis. The sizes of the DNA bands are indicated. Equality of sample loading was verified by quantification of an unrelated gene, β-globulin, in these samples. C, GH-dependent increase in expression of ZEB2-NAT. Immortalized differentiated human podocytes were exposed to hGH (500 ng/ml) for the indicated time periods as detailed under “Experimental Procedures.” The steady state abundance of the ZEB2 transcript was measured by RT-qPCR and is depicted relative to ZEB2 mRNA abundance prior to exposure to GH; GAPDH was used as an internal control. Error bars indicate mean ± S.E.; n = 4–5. *, p < 0.05 (Kruskal-Wallis test) compared with expression prior to exposure to GH. D, HepG2 cells were transiently transfected with ZEB2-NAT promoter-reporter luciferase construct and then exposed to either vehicle or hGH (500 ng/ml) for 24 h as detailed under “Experimental Procedures.” Cotransfection of Renilla luciferase was used to normalize transfection efficiency. The normalized luciferase activity of the cell exposed to GH (gray bar) is depicted relative to activity of the cells exposed to vehicle alone (black bar) designated as 100%. Error bars indicate mean ± S.E.; n = 4. *, p < 0.05 compared with vehicle-treated cells.
FIGURE 3.
FIGURE 3.
Reciprocal decrease in E-cadherin expression with GH-dependent increase in ZEB2 expression in glomerular podocyte. A, immortalized differentiated human podocytes were exposed to hGH (500 ng/ml) as detailed under “Experimental Procedures.” E-cadherin mRNA abundance was measured by RT-qPCR and is depicted relative to E-cadherin mRNA abundance prior to exposure to GH; GAPDH was used as an internal control. The results (n = 4–5) are depicted as mean ± S.E. *, p < 0.05 (Kruskal-Wallis test) compared with expression prior to exposure to GH. B, immortalized differentiated human podocytes were exposed to hGH (500 ng/ml) for the indicated time periods and subjected to Western blot analysis for E-cadherin and tubulin as detailed under “Experimental Procedures.” Results shown are representative of three independent experiments. C, immortalized differentiated human podocytes were exposed to the indicated concentrations of hGH for 48 h and subjected to Western blot analysis sequentially for ZEB2, E-cadherin, and tubulin as detailed under “Experimental Procedures.” Results shown are representative of three independent experiments. D, immortalized differentiated murine podocytes (MPC-5) were exposed to ovine GH (oGH) (500 ng/ml) for the indicated time periods as detailed under “Experimental Procedures.” ZEB2 mRNA abundance was measured by RT-qPCR and is depicted relative to ZEB2 mRNA abundance prior to exposure to GH; GAPDH was used as an internal control. Error bars indicate mean ± S.E.; n = 4–5. *, p < 0.05 (Kruskal-Wallis test) compared with expression prior to exposure to ovine GH. E, immortalized differentiated murine podocytes (MPC-5) were exposed to ovine GH (500 ng/ml) for the indicated time periods and then subjected to Western blot analysis sequentially for ZEB2, E-cadherin, and tubulin as detailed under “Experimental Procedures.” Results shown are representative of three independent experiments.
FIGURE 4.
FIGURE 4.
GH-dependent decrease in P-cadherin expression in glomerular podocyte. A, immortalized differentiated human podocytes were exposed to hGH (500 ng/ml) for the indicated time periods as detailed under “Experimental Procedures.” P-cadherin mRNA abundance was measured by RT-qPCR and is depicted relative to P-cadherin mRNA abundance prior to exposure to GH; GAPDH was used as an internal control. Error bars indicate mean ± S.E.; n = 4–5. *, p < 0.05 (Kruskal-Wallis test) compared with expression prior to exposure to GH. B, immortalized differentiated human podocytes were exposed to hGH (500 ng/ml) for the indicated time periods and subjected to Western blot analysis for P-cadherin and tubulin as detailed under “Experimental Procedures.” HepG2 lysates were also similarly analyzed as a positive control. Results shown are representative of three independent experiments.
FIGURE 5.
FIGURE 5.
GH-dependent decrease in E-cadherin promoter activity is mediated via ZEB2 binding sites on E-cadherin promoter. A, spatial organization of conserved E2 boxes (putative ZEB2 binding sites) on the E-cadherin promoter (E-cad-prom) (top schematic). The bottom schematic depicts the point mutations (underlined) introduced in the two E-boxes (Mut E2-box) designed to abrogate binding of ZEB2 to the E2 box ZEB2 binding sites on the E-cadherin promoter. B, HepG2 cells were transiently transfected with E-cadherin promoter-luciferase construct and then exposed to the indicated concentration of hGH for 24 h as detailed under “Experimental Procedures.” Cotransfection of Renilla luciferase was used to normalize transfection efficiency. The normalized luciferase activity of the cell exposed to GH is depicted relative to activity of the cells exposed to vehicle alone designated as 100%. Error bars indicate mean ± S.E.; n = 4. *, p < 0.05 compared with vehicle-treated cells. C, HepG2 cells were transiently transfected with either E-cadherin promoter-luciferase (E-cad-luc) (black bar) or E-cadherin promoter-luciferase construct with point mutations in the two E2 boxes (gray bar) and exposed to hGH (500 ng/ml) for the indicated time periods as detailed under “Experimental Procedures.” Cotransfection of Renilla luciferase was used to normalize transfection efficiency. The normalized luciferase activity for each individual construct exposed to GH is depicted relative to activity of the respective construct exposed to vehicle alone designated as 100%. Error bars indicate mean ± S.E.; n = 5–7. *, p < 0.01 compared with vehicle-treated cells.
FIGURE 6.
FIGURE 6.
Knockdown of ZEB2 expression in glomerular podocytes abrogates GH-dependent decrease in E-cadherin expression. A, immortalized human podocytes cultured under growth-permissive conditions were transduced with lentiviral constructs expressing either ZEB2 shRNA (shRNAs 1 and 2) or scrambled shRNA. Following transduction, cells were expanded, and aliquots were induced to differentiate for 14 days prior to harvesting of RNA for analysis. Steady state ZEB2 mRNA abundance was measured by RT-qPCR; GAPDH was used as an internal control. The results (n = 4–5) are depicted as mean ± S.E. The steady state abundance of the ZEB2 transcript is depicted relative to ZEB2 mRNA abundance in non-transduced naïve cells. B, immortalized human podocytes transduced with lentiviral constructs expressing either ZEB2 shRNA (shRNAs 1 and 2) or scrambled shRNA were differentiated for 14 days and then subjected to Western blot analysis for ZEB2 and tubulin as detailed under “Experimental Procedures.” Results shown are representative of two independent experiments. C, immortalized human podocytes transduced with lentiviral construct expressing either scrambled shRNA (left panel) or ZEB2 shRNA 2 (right panel) were differentiated, exposed to hGH (500 ng/ml), and subjected to Western blot analysis for E-cadherin and tubulin as detailed under “Experimental Procedures.” Densitometric analysis of the E-cadherin band, normalized for respective tubulin expression, is depicted relative to expression prior to exposure to GH. Error bars indicate mean ± S.E.; n = 4. *, p < 0.05 (Kruskal-Wallis test) compared with expression prior to exposure to GH.
FIGURE 7.
FIGURE 7.
ZEB2 is essential for GH-dependent increase in permeability of podocyte monolayer. Immortalized human podocytes transduced with lentiviral construct expressing ZEB2 shRNAs 1 and 2 (right), untransduced (left), or transduced with lentiviral construct expressing scrambled shRNA (left) were grown as a monolayer on collagen-coated Transwell filters and induced to differentiate for 14 days prior to incubation with vehicle (black bar), hGH (500 ng/ml) (gray bar), or TGF-β (white bar) for 48 h, and albumin permeability across the podocyte monolayer was determined at 1, 2, and 4 h following the 48-h exposure to hGH. Error bars indicate mean ± S.E.; n = 4. The data for the TGF-β experiments are depicted as the average of two experiments. *, p < 0.05 versus control (CON).
FIGURE 8.
FIGURE 8.
Proposed model for role of ZEB2 in GH action on glomerular podocyte. Engagement of the GHR by GH results in increased activity of promoters for ZEB2-NAT and ZEB2 mRNA. These changes in promoter activities result in increased expression of ZEB2-NAT and ZEB2 mRNA. ZEB2-NAT impairs splicing of the internal ribosome entry site (IRES)-containing intron, thus facilitating translation of ZEB2 protein. ZEB2 protein interacts with promoters of P- and E-cadherins to inhibit expression of the cognate gene. P-cadherin is an essential component of the slit diaphragm apparatus, which is central to the size selectivity of the glomerular filtration barrier. Deceased E-cadherin expression is implicated in epithelial-mesenchymal transition that results in podocyte dehiscence and loss in disease states such as diabetes mellitus. These changes in P- and E-cadherin expression will manifest as impaired podocyte function and proteinuria in pathological states of GH/GHR axis overactivity in the kidney (e.g. acromegaly and type 1 diabetes mellitus (DM)).

Similar articles

Cited by

References

    1. Møller N., Jørgensen J. O. (2009) Endocr. Rev. 30, 152–177 - PubMed
    1. Pantaleon M., Whiteside E. J., Harvey M. B., Barnard R. T., Waters M. J., Kaye P. L. (1997) Proc. Natl. Acad. Sci. U.S.A. 94, 5125–5130 - PMC - PubMed
    1. Han X., Ren X., Jurickova I., Groschwitz K., Pasternak B. A., Xu H., Wilson T. A., Hogan S. P., Denson L. A. (2009) Gut 58, 49–58 - PMC - PubMed
    1. Lu C., Schwartzbauer G., Sperling M. A., Devaskar S. U., Thamotharan S., Robbins P. D., McTiernan C. F., Liu J. L., Jiang J., Frank S. J., Menon R. K. (2001) J. Biol. Chem. 276, 22892–22900 - PubMed
    1. Baudet M. L., Rattray D., Martin B. T., Harvey S. (2009) Endocrinology 150, 2758–2766 - PubMed

Publication types

MeSH terms