

New behavioral protocols to extend our knowledge of rodent object recognition memory
- PMID: 20682810
- PMCID: PMC2920753
- DOI: 10.1101/lm.1879610
New behavioral protocols to extend our knowledge of rodent object recognition memory
Abstract
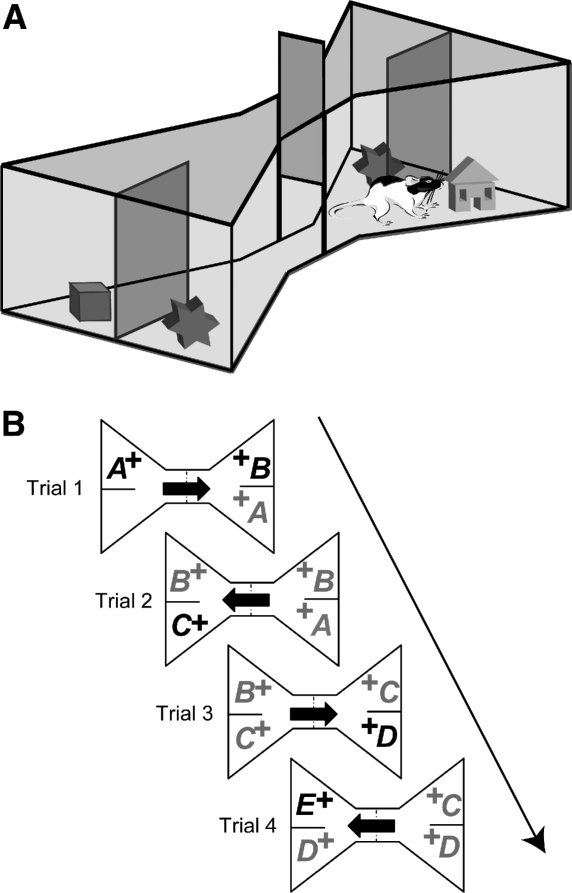
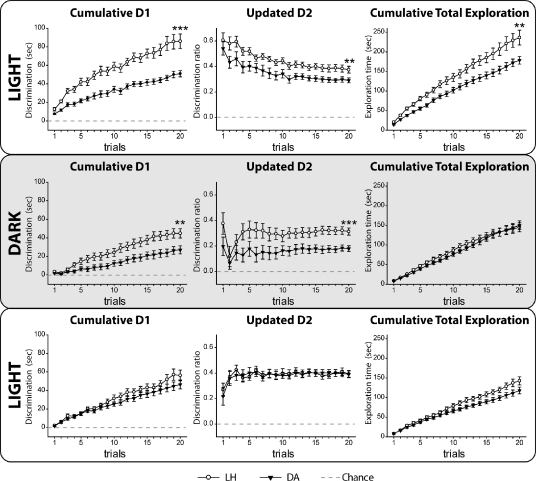
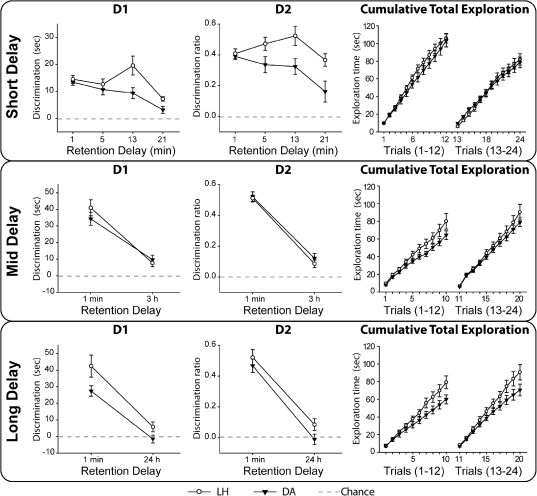
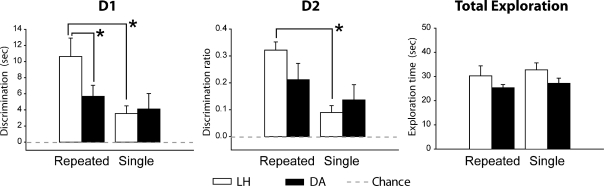
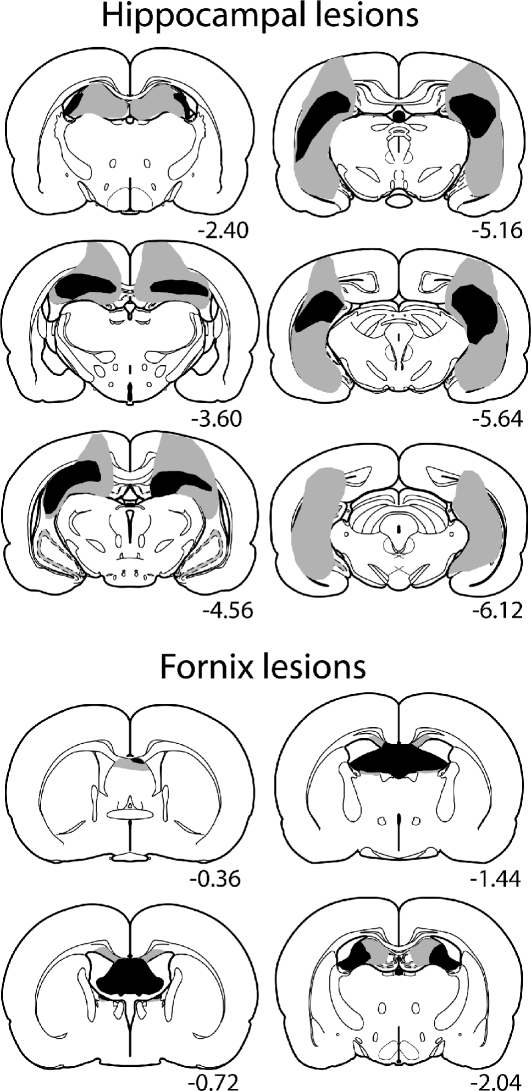
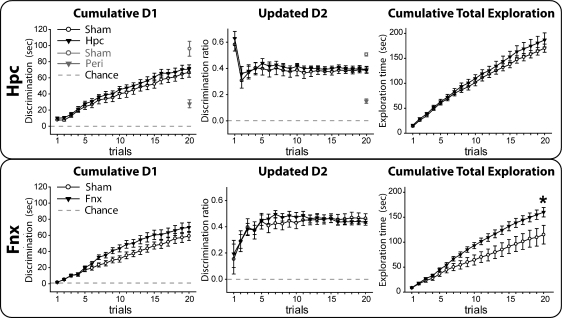
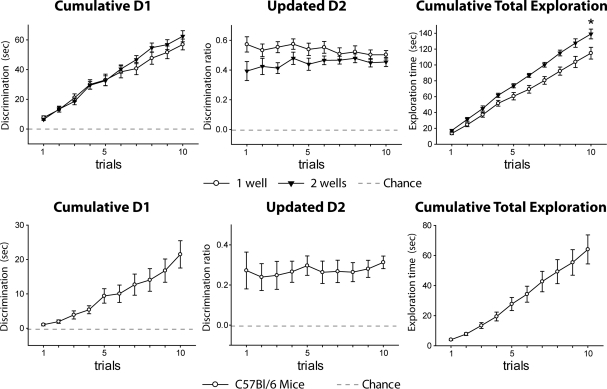
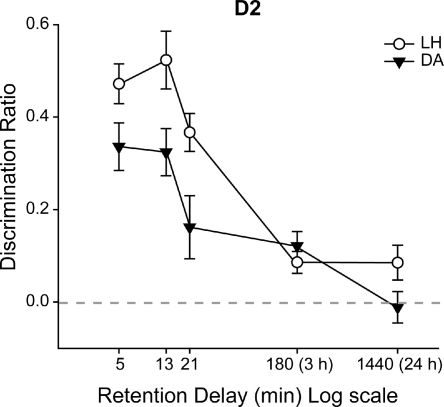
Animals often show an innate preference for novelty. This preference facilitates spontaneous exploration tasks of novelty discrimination (recognition memory). In response to limitations with standard spontaneous object recognition procedures for rodents, a new task ("bow-tie maze") was devised. This task combines features of delayed nonmatching-to-sample with spontaneous exploration. The present study explored aspects of object recognition in the bow-tie maze not amenable to standard procedures. Two rat strains (Lister Hooded, Dark Agouti) displayed very reliable object recognition in both the light and dark, with the Lister Hooded strain showing superior performance (Experiment 1). These findings reveal the potential contribution of tactile and odor cues in object recognition. As the bow-tie maze task permits multiple trials within a session, it was possible to derive forgetting curves both within-session and between-sessions (Experiment 1). In Experiment 2, rats with hippocampal or fornix lesions performed at normal levels on the basic version of the recognition task, contrasting with the marked deficits previously seen after perirhinal cortex lesions. Next, the training protocol was adapted (Experiment 3), and this modified version was used successfully with mice (Experiment 4). The overall findings demonstrate the efficacy of this new behavioral task and advance our understanding of object recognition.
Figures
Similar articles
-
Perirhinal cortex lesions uncover subsidiary systems in the rat for the detection of novel and familiar objects.Eur J Neurosci. 2011 Jul;34(2):331-42. doi: 10.1111/j.1460-9568.2011.07755.x. Epub 2011 Jun 27. Eur J Neurosci. 2011. PMID: 21707792 Free PMC article.
-
A new behavioural apparatus to reduce animal numbers in multiple types of spontaneous object recognition paradigms in rats.J Neurosci Methods. 2012 Oct 15;211(1):66-76. doi: 10.1016/j.jneumeth.2012.08.006. Epub 2012 Aug 16. J Neurosci Methods. 2012. PMID: 22917958
-
Evidence that the rat hippocampus has contrasting roles in object recognition memory and object recency memory.Behav Neurosci. 2012 Oct;126(5):659-69. doi: 10.1037/a0029754. Behav Neurosci. 2012. PMID: 23025831 Free PMC article.
-
Advances in the behavioural testing and network imaging of rodent recognition memory.Behav Brain Res. 2015 May 15;285:67-78. doi: 10.1016/j.bbr.2014.07.049. Epub 2014 Aug 11. Behav Brain Res. 2015. PMID: 25106740 Free PMC article. Review.
-
Assessing rodent hippocampal involvement in the novel object recognition task. A review.Behav Brain Res. 2015 May 15;285:105-17. doi: 10.1016/j.bbr.2014.08.002. Epub 2014 Aug 26. Behav Brain Res. 2015. PMID: 25169255 Free PMC article. Review.
Cited by
-
Neuronal circuitry for recognition memory of object and place in rodent models.Neurosci Biobehav Rev. 2022 Oct;141:104855. doi: 10.1016/j.neubiorev.2022.104855. Epub 2022 Sep 8. Neurosci Biobehav Rev. 2022. PMID: 36089106 Free PMC article. Review.
-
Continual Trials Spontaneous Recognition Tasks in Mice: Reducing Animal Numbers and Improving Our Understanding of the Mechanisms Underlying Memory.Front Behav Neurosci. 2018 Sep 13;12:214. doi: 10.3389/fnbeh.2018.00214. eCollection 2018. Front Behav Neurosci. 2018. PMID: 30271334 Free PMC article.
-
Strain-dependent variations in spatial learning and in hippocampal synaptic plasticity in the dentate gyrus of freely behaving rats.Front Behav Neurosci. 2011 Mar 7;5:7. doi: 10.3389/fnbeh.2011.00007. eCollection 2011. Front Behav Neurosci. 2011. PMID: 21436876 Free PMC article.
-
Contrasting networks for recognition memory and recency memory revealed by immediate-early gene imaging in the rat.Behav Neurosci. 2014 Aug;128(4):504-22. doi: 10.1037/a0037055. Epub 2014 Jun 16. Behav Neurosci. 2014. PMID: 24933661 Free PMC article.
-
What pharmacological interventions indicate concerning the role of the perirhinal cortex in recognition memory.Neuropsychologia. 2012 Nov;50(13):3122-40. doi: 10.1016/j.neuropsychologia.2012.07.034. Epub 2012 Jul 27. Neuropsychologia. 2012. PMID: 22841990 Free PMC article. Review.
References
-
- Aggleton JP 1985. One-trial object recognition by rats. Q J Exp Psychol 37B: 279–294
-
- Aggleton JP 1996. The ability of different strains of rats to acquire a visual nonmatching-to-sample task. Psychobiology 24: 44–48
-
- Aggleton JP, Brown MW 1999. Episodic memory, amnesia, and the hippocampal-anterior thalamic axis. Behav Brain Sci 22: 425–444; discussion 444–489 - PubMed
-
- Aggleton JP, Brown MW 2006. Interleaving brain systems for episodic and recognition memory. Trends Cogn Sci 10: 455–463 - PubMed
-
- Aggleton JP, Vann SD 2004. Testing the importance of the retrosplenial navigation system: Lesion size but not strain matters: A reply to Harker and Whishaw. Neurosci Biobehav Rev 28: 525–531 - PubMed
Publication types
MeSH terms
Grants and funding
LinkOut - more resources
Full Text Sources
Other Literature Sources
Research Materials
Miscellaneous