. 2010 Oct;299(4):E657-64.
doi: 10.1152/ajpendo.00707.2009. Epub 2010 Aug 3.

Estrogen sulfotransferase regulates body fat and glucose homeostasis in female mice

Affiliations

Estrogen sulfotransferase regulates body fat and glucose homeostasis in female mice

Victor K Khor et al. Am J Physiol Endocrinol Metab. 2010 Oct.

Abstract

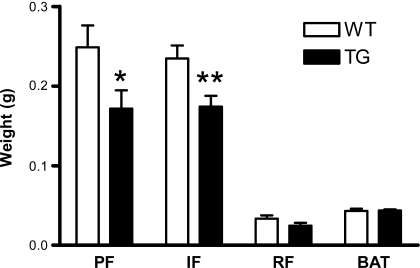
Estrogen regulates fat mass and distribution and glucose metabolism. We have previously found that estrogen sulfotransferase (EST), which inactivates estrogen through sulfoconjugation, was highly expressed in adipose tissue of male mice and induced by testosterone in female mice. To determine whether inhibition of estrogen in female adipose tissue affects adipose mass and metabolism, we generated transgenic mice expressing EST via the aP2 promoter. As expected, EST expression was increased in adipose tissue as well as macrophages. Parametrial and subcutaneous inguinal adipose mass and adipocyte size were significantly reduced in EST transgenic mice, but there was no change in retroperitoneal or brown adipose tissue. EST overexpression decreased the differentiation of primary adipocytes, and this was associated with reductions in the expression of peroxisome proliferator-activated receptor-γ, fatty acid synthase, hormone-sensitive lipase, lipoprotein lipase, and leptin. Serum leptin levels were significantly lower in EST transgenic mice, whereas total and high-molecular-weight adiponectin levels were not different in transgenic and wild-type mice. Glucose uptake was blunted in parametrial adipose tissue during hyperinsulinemic-euglycemic clamp in EST transgenic mice. In contrast, hepatic insulin sensitivity was improved but muscle insulin sensitivity did not change in EST transgenic mice. These results reveal novel effects of EST on adipose tissue and glucose homeostasis in female mice.


Figures

Fig. 1.
Fig. 1.
Generation and identification of aP2-EST (estrogen sulfotransferase) transgenic (TG) mice. A: schema of the transgene construct. TG founders were identified using primers (P1 and P2) specific to the transgene. Northern blot analysis (B) and quantitative real-time PCR (C) detected abundant EST mRNA expression in parametrial white adipose tissue (WAT) and naïve peritoneal macrophages from female mice. Lower levels of EST mRNA expression were also found in the heart, kidney, lungs, and spleen. No EST mRNA expression was detected in tissues examined from wild-type (WT) female mice. D: EST mRNA expression in parametrial (PF), inguinal (IF), and retroperitoneal (RF) fat and brown adipose tissue (BAT) depots (n = 5). E: EST protein levels in parametrial WAT from transgenic mice. F: EST enzyme activity in parametrial WAT tissue from transgenic female mice vs. WT male epididymal WAT (EF; n = 4–5). No enzyme activity was detected in WT female parametrial WAT. WTM, wild-type male. Data presented are means ± SE. *P ≤ 0.05 vs. WTM EF.
Fig. 2.
Fig. 2.
Fat mass in EST TG (filled bar) and WT female mice (open bar). Data presented are means ± SE; n = 13–14. *P ≤ 0.05 vs. WT; **P ≤ 0.01 vs. WT.
Fig. 3.
Fig. 3.
A and B: hematoxylin & eosin-stained sections of parametrial WAT from WT (A) and EST TG female mice (B). Scale bar, 100 μm. C and D: histograms comparing distribution of adipocytes in parametrial (C) and inguinal subcutaneous (D) WAT from WT (open bar) and EST TG female mice (filled bar). See text for definitions.
Fig. 4.
Fig. 4.
A and B: primary adipocyte differentiation of subcutaneous WAT from WT and EST TG female mice. C and D: mRNA levels of EST and adipogenic genes in WT and EST TG primary adipocytes. Data presented are means ± SE. **P ≤ 0.01 vs. WT; ***P ≤ 0.001 vs. WT. Scale bar, 100 μm.
Fig. 5.
Fig. 5.
Hyperinsulinemic-euglycemic clamp of WT (open bar) and EST TG female mice (filled bar). A: glucose infusion rate (GIR), hepatic glucose production (HGP), and glucose disappearance rate (Rd). B: glucose uptake in parametrial WAT. C: glucose uptake in skeletal muscle. D: ratio of p-Akt and total Akt protein levels in livers of clamped mice. E and F: mRNA levels of G6Pase and PEPCK in livers of clamped mice. G–I: mRNA levels of IL-1β, monocyte chemoattractant protein-1 (MCP1), and F4/80 in parametrial WAT. Data are means ± SE; n = 9 mice per group. *P ≤ 0.05 vs. WT; **P ≤ 0.01 vs. WT; ***P ≤ 0.001 vs. WT.

Similar articles

Cited by

References

    1. Ahima RS, Dushay J, Flier SN, Prabakaran D, Flier JS. Leptin accelerates the onset of puberty in normal female mice. J Clin Invest 99: 391– 395, 1997 - PMC - PubMed
    1. Ahmed-Sorour H, Bailey CJ. Role of ovarian hormones in the long-term control of glucose homeostasis, glycogen formation and gluconeogenesis. Ann Nutr Metab 25: 208– 212, 1981 - PubMed
    1. Akpan I, Goncalves MD, Dhir R, Yin X, Pistilli EE, Bogdanovich S, Khurana TS, Ucran J, Lachey J, Ahima RS. The effects of a soluble activin type IIB receptor on obesity and insulin sensitivity. Int J Obes (Lond) 33: 1265– 1273, 2009 - PMC - PubMed
    1. Bjorntorp P. Adipose tissue distribution and function. Int J Obes 15, Suppl 2: 67– 81, 1991 - PubMed
    1. Clegg DJ, Brown LM, Woods SC, Benoit SC. Gonadal hormones determine sensitivity to central leptin and insulin. Diabetes 55: 978– 987, 2006 - PubMed

Publication types

MeSH terms

LinkOut - more resources