Comparative Study
. 2010 Aug;83(2):230-40.
doi: 10.4269/ajtmh.2010.09-0179.

Comparing the effectiveness of malaria vector-control interventions through a mathematical model

Affiliations
Comparative Study

Comparing the effectiveness of malaria vector-control interventions through a mathematical model

Nakul Chitnis et al. Am J Trop Med Hyg. 2010 Aug.

Abstract

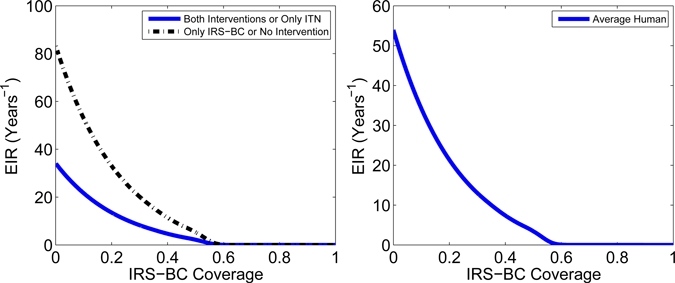
Although some malaria-control programs are beginning to combine insecticide-treated nets (ITNs) and indoor residual spraying (IRS), little is known about the effectiveness of such combinations. We use a mathematical model to compare the effectiveness of ITNs and IRS with dichlorodiphenyltrichloroethane (DDT) or bendiocarb, applied singly and in combination, in an epidemiological setting based in Namawala, Tanzania, with Anopheles gambiae as the primary vector. Our model indicates that although both IRS (with DDT) and ITNs provide personal protection, humans with only ITNs are better protected than those with only IRS, and suggests that high coverage of IRS with bendiocarb may interrupt transmission, as can simultaneous high coverage of ITNs and IRS with DDT. When adding a second vector-control intervention, it is more effective to cover the unprotected population first. Although our model includes some assumptions and approximations that remain to be addressed, these findings should be useful for prioritizing and designing future field research.


Figures

Figure 1.
Figure 1.
Cartoon of mosquito feeding cycle. The feeding (or gonotrophic) cycle of the female mosquito vector. After emergence, mosquitoes seek and bite hosts, rest, and lay eggs before seeking hosts again. The mosquito experiences varying levels of risk in each state. Modified from Figure in ref. . This figure appears in color at www.ajtmh.org.
Figure 2.
Figure 2.
Schematic describing the processes in the feeding cycle of the female mosquito. New mosquitoes emerge from water bodies (and mate) at rate Nv0 into the host-seeking state A, where they actively search for blood meals. A mosquito may encounter and feed on up to n different types of hosts. Each type of host, represented by subscript i for 1 ≤ in, is available to mosquitoes at rate αi. If a mosquito does not encounter a host in a given night, it waits in the host-seeking phase until the next night, with probability, PA. When a mosquito encounters a host of type i and is committed to biting the host, it moves to state Bi. If the mosquito bites, it moves to state Ci, where it searches for a resting place. If it finds a resting place, it moves to state Di, where it rests for τ days. After resting, the mosquito moves to state Ei, where it seeks to lay eggs. If it is successful in laying eggs, it returns to host-seeking state, A, where it may then encounter any type of host. At each state, the mosquito may die with some probability, labeled by subscript μ. Reproduced, with permission, from figure 2 in ref. .
Figure 3.
Figure 3.
Human infectivity to mosquitoes as a function of EIR. (A) EIR on a logarithmic scale. (B) Low EIR on a linear scale. Human simulation model results from Killeen and others for human infectivity to mosquitoes, Kvi, as a function of EIR and a least-squares fit of a closed-form expression approximation to these simulations. Each simulation result value of the human infectivity to mosquitoes is averaged over the human population over 1 year. The details of the closed-form expression are given in the Appendix. This figure appears in color at www.ajtmh.org.
Figure 4.
Figure 4.
Effects of three intervention strategies, applied singly, on entomological quantities that measure mosquito survival and potential to transmit malaria in an epidemiological setting based on Namawala, Tanzania, with baseline and intervention-modified parameter values shown in Tables 3 and 4 and described in the Appendix. The plots for the delayed oocyst rate and sporozoite rate show that coverage over 80% of IRS with bendiocarb interrupts transmission. (A) The parous rate, as a function of intervention coverage, measures the probability of a mosquito surviving each feeding cycle. (B) The vectorial capacity, as a function of intervention coverage, measures the potential of the mosquito population to transmit malaria. (C) The delayed oocyst rate, as a function of intervention coverage, is the proportion of mosquitoes that are infected. (D) The sporozoite rate, as a function of intervention coverage, is the proportion of mosquitoes that are infectious to humans. This figure appears in color at www.ajtmh.org.
Figure 5.
Figure 5.
Effects of three intervention strategies, applied singly, on the host-biting rate and EIR in an epidemiological setting based on Namawala, Tanzania, with baseline and intervention-modified parameter values shown in Tables 3 and 4 and described in the Appendix. The plots on the right represent an average member of the human population. The plots on the left show the human population divided into two groups: the curves with squares represent the humans that are protected by a malaria-control intervention, and curves with circles represent the unprotected humans in a population partially protected by a malaria-control intervention. Because IRS with bendiocarb does not provide personal protection, the protected and unprotected humans have the same EIR and host-biting rate, and therefore, we only show one curve. The intervention coverage does not start at 0 but slightly above 0; where the curves appear to touch the y axis, one individual is protected. (A) The host-biting rate, as a function of intervention coverage, measures the number of mosquito bites per person per day. Note that for IRS with DDT, while the host-biting rate increases for both protected and unprotected humans as coverage increases, since the proportion of protected humans increases, the host-biting rate for the average human decreases. (B) The EIR, as a function of intervention coverage, measures the number of infectious bites per person per year. We see the community effects of both ITNs and IRS with DDT, because increasing coverage reduces the EIR for both protected and unprotected humans. At any coverage level, IRS with DDT is not as effective as the use of ITNs, which are not as effective as IRS with bendiocarb, in reducing transmission. We again see that coverage over 80% of IRS with bendiocarb interrupts transmission. This figure appears in color at www.ajtmh.org.
Figure 6.
Figure 6.
The EIR, measured as infectious bites per person per year, versus coverage of IRS with DDT in a population with a pre-existing ITN coverage level of 60% in an epidemiological setting based on Namawala, Tanzania, with baseline and intervention-modified parameter values described in the Appendix. The figure on the right shows the EIR for an average member of the human population, whereas the figure on the left shows the EIR for each intervention group. When IRS coverage is 0%, 40% of the human population is unprotected, and 60% is protected by ITNs. As the IRS coverage increases, the unprotected humans move to the group that is protected only by IRS, and the ITN users move to the group that is protected by both interventions. Finally, at 100% IRS coverage, 40% of the human population is protected only by IRS with DDT, and 60% is protected by both ITNs and IRS. We see that ITNs provide slightly better personal protection than IRS with DDT, because humans protected by only ITNs have a lower EIR than humans protected by only IRS with DDT. This figure appears in color at www.ajtmh.org.
Figure 7.
Figure 7.
The EIR, measured as infectious bites per person per year, versus coverage of IRS with bendiocarb in a population with a pre-existing ITN coverage level of 60% in an epidemiological setting based on Namawala, Tanzania, with baseline and intervention-modified parameter values described in the Appendix. The figure on the right shows the EIR for an average member of the human population, whereas the figure on the left shows the EIR for each intervention group. Because IRS with bendiocarb does not provide any personal protection (it does not repel or kill mosquitoes before they bite) but only community protection, it does not directly reduce the EIR of a user. Thus, at any coverage level of IRS-BC, humans protected only by IRS-BC have the same EIR as unprotected humans, and humans protected by both IRS-BC and ITNs have the same EIR as humans protected by only ITNs. When IRS coverage is 0%, 40% of the human population is unprotected, and 60% is protected by ITNs. As the IRS coverage increases, the unprotected humans move to the group that is protected only by IRS, and the ITN users move to the group that is protected by both interventions. Finally, at 100% IRS coverage, 40% of the human population is protected only by IRS with bendiocarb, and 60% is protected by both ITNs and IRS. We see strong community effects of IRS-BC with interruption of transmission with coverage above 70%. We note that although the combination of ITNs and IRS with bendiocarb improves control, interruption of transmission occurs at a similar level of IRS-BC coverage as when it is used on its own. This figure appears in color at www.ajtmh.org.
Figure 8.
Figure 8.
The EIR, measured as infectious bites per person per year, versus coverage of IRS with DDT in a population with a pre-existing ITN coverage level of 80% in an epidemiological setting based on Namawala, Tanzania, with baseline and intervention-modified parameter values described in the Appendix. The figure on the right shows the EIR for an average member of the human population, whereas the figure on the left shows the EIR for each intervention group. When IRS coverage is 0%, 20% of the human population is unprotected, and 80% is protected by ITNs. As the IRS coverage increases, the unprotected humans move to the group that is protected only by IRS, and the ITN users move to the group that is protected by both interventions. Finally, at 100% IRS coverage, 20% of the human population is protected only by IRS with DDT, and 80% is protected by both ITNs and IRS. We see the community effects of IRS, because increasing coverage reduces the EIR for all groups, including the unprotected humans. We also see that ITNs provide slightly better personal protection than IRS with DDT. Because IRS-DDT coverage approaches 100%, EIR approaches 0, and therefore, very high coverage of ITNs and IRS-DDT can substantially reduce or even interrupt transmission. This figure appears in color at www.ajtmh.org.
Figure 9.
Figure 9.
The EIR, measured as infectious bites per person per year, versus coverage of ITNs in a population with a pre-existing coverage level of IRS with DDT of 85% in an epidemiological setting based on Namawala, Tanzania, with baseline and intervention-modified parameter values described in the Appendix. The figure on the right shows the EIR for an average member of the human population, whereas the figure on the left shows the EIR for each intervention group. When ITN coverage is 0%, 15% of the human population is unprotected, and 85% is protected by IRS-DDT. As the ITN coverage increases, the unprotected humans move to the group that is protected only by ITNs, and the humans protected by IRS-DDT move to the group that is protected by both interventions. Finally, at 100% ITN coverage, 15% of the human population is protected only by ITNs, and 85% is protected by both ITNs and IRS. We see the community effects of ITNs, because increasing coverage reduces the EIR for all groups, including the unprotected humans. We also see that ITNs provide slightly better personal protection than IRS with DDT. Similar to Figure 8, we see that very high coverage levels of both ITNs and IRS-DDT can interrupt transmission. This figure appears in color at www.ajtmh.org.

References

    1. Chitnis N, Smith T, Steketee R. A mathematical model for the dynamics of malaria in mosquitoes feeding on a heterogeneous host population. J Biol Dyn. 2008;2:259–285. - PubMed
    1. Smith T, Maire N, Ross A, Penny M, Chitnis N, Schapira A, Studer A, Genton B, Lengeler C, Tediosi F, de Savigny D, Tanner M. Towards a comprehensive simulation model of malaria epidemiology and control. Parasitology. 2008;135:1507–1516. - PubMed
    1. Saul AJ, Graves PM, Kay BH. A cyclical feeding model for pathogen transmission and its application to determine vector capacity from vector infection rates. J Appl Ecol. 1990;27:123–133.
    1. Saul A. Zooprophylaxis or zoopotentiation: the outcome of introducing animals on vector transmission is highly dependent on the mosquito mortality while searching. Malar J. 2003;32 - PMC - PubMed
    1. Le Menach A, Takala S, McKenzie FE, Perisse A, Harris A, Flahault A, Smith DL. An elaborated feeding cycle model for reductions in vectorial capacity of night-biting mosquitoes by insecticide-treated nets. Malar J. 2007;6 - PMC - PubMed

Publication types