. 2010 Aug;83(2):400-12.
doi: 10.4269/ajtmh.2010.10-0076.

West Nile virus emergence and persistence in Los Angeles, California, 2003-2008

Affiliations

West Nile virus emergence and persistence in Los Angeles, California, 2003-2008

Jennifer L Kwan et al. Am J Trop Med Hyg. 2010 Aug.

Abstract

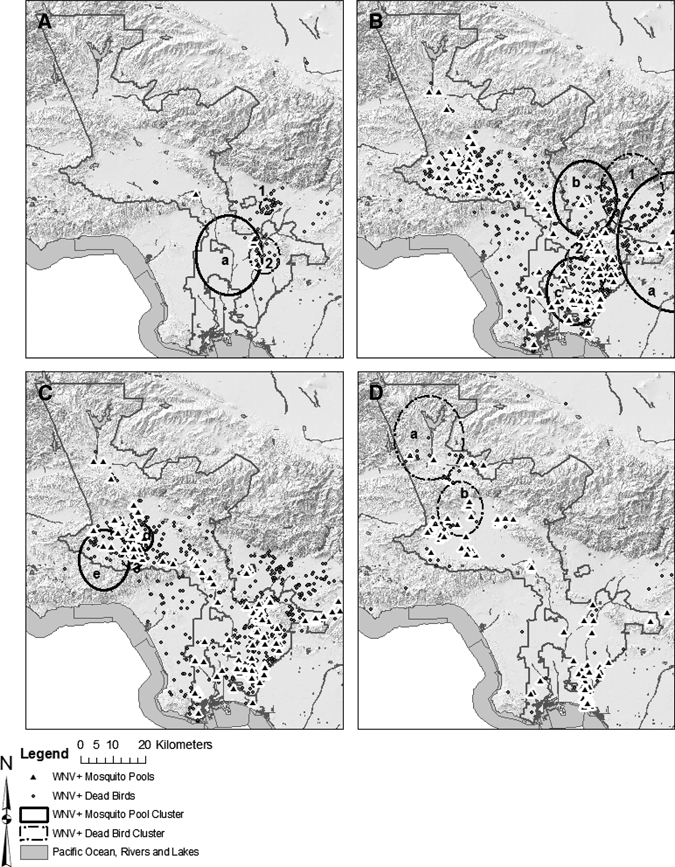
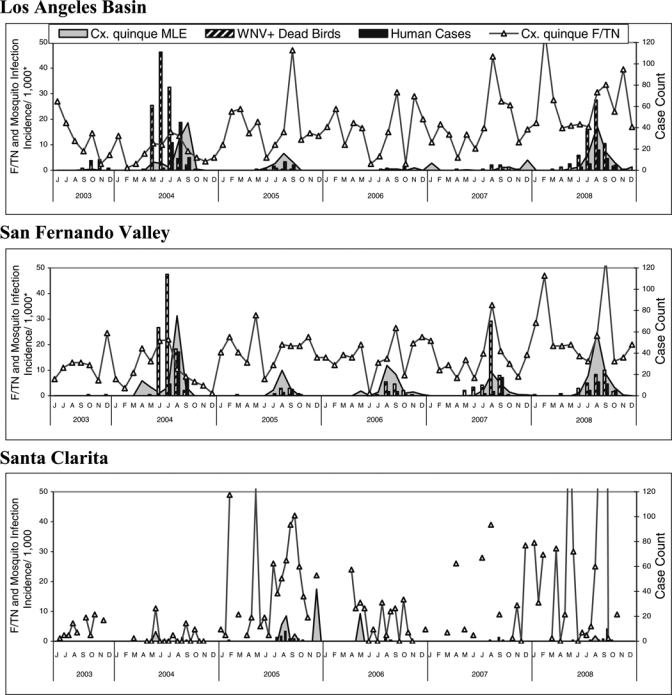
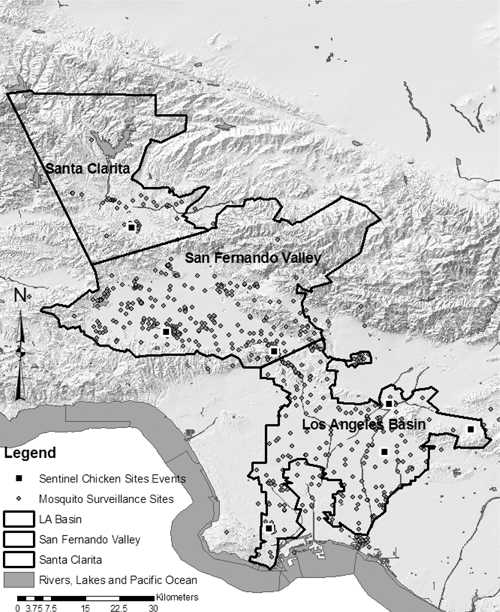
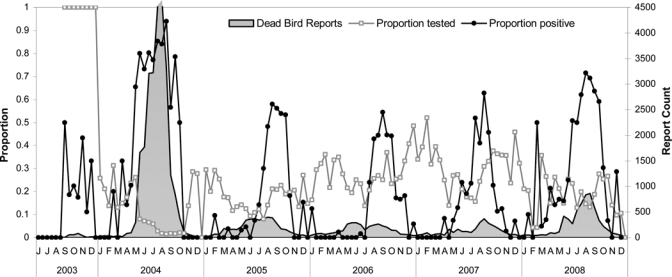
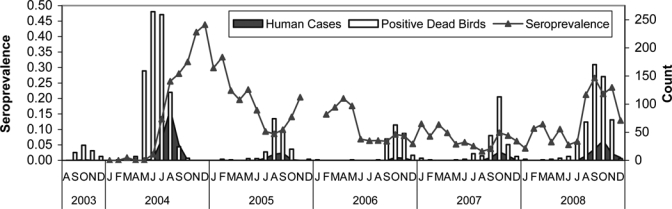
West Nile virus (WNV) invaded Los Angeles in September 2003, and during the subsequent five-year period followed a pattern of amplification, subsidence, and resurgence. Enzootic transmission was tracked by abundance and infection incidence in Culex pipiens quinquefasciatus and Cx. tarsalis and by seroprevalence in peridomestic passerine birds, infection in dead birds, and seroconversions in sentinel chickens. Culex p. quinquefasciatus served as the primary vector of WNV, with gravid traps serving as the best sampling method and the most consistent indicator of viral activity. Spatial scan statistics applied to mosquito infection and positive dead bird data delimited three major clusters of WNV transmission, with introduction occurring in the Los Angeles Basin, and amplification and dispersal events carrying transmission to the San Fernando and Santa Clarita valleys. Los Angeles experienced major epidemics in 2004 and 2008, providing a unique opportunity to investigate specific patterns of enzootic amplification preceding epidemics.


Figures

Figure 1.
Figure 1.
Time-space clusters of West Nile virus (WNV) plus dead birds (dots) and WNV+ mosquito pools (triangles) in Los Angeles County. The first evidence in the Los Angeles Basin in 2003 (A) with mosquito pool cluster a (10/9/2003–10/29/2003), and dead bird clusters 1 (9/13/2003–10/15/2003) and 2 (10/30/2003–12/3/2003). Amplification in the Los Angeles Basin in early 2004 (B) depicted by dead bird clusters 1 (5/8/2004–6/4/2004) and 2 (5/29/2004–7/2/2004) overlapping with mosquito pool clusters a–c (6/26/2004–7/30/2004, 7/3/2004–8/6/2004, and 7/10/2004–8/13/2004), then progressing into the San Fernando Valley in late 2004 (C) dead bird cluster 3 (7/10/2004–8/13/2004), and mosquito pool clusters d (7/24/2004–8/20/2004) and e (7/24/2004-8/20/2004). Amplification in Santa Clarita in 2005 (D) with dead bird clusters a (7/24/2005–6/27/2005) and b (9/11/2005–10/8/2005).
Figure 2.
Figure 2.
The 2004 WNV epizootic within the Greater Los Angeles County Vector Control District boundary (gray line), represented by positive dead birds (circles). Arrows indicate major corvid roosting sites.
Figure 3.
Figure 3.
Biweekly temperature and rainfall for the three regions of Los Angeles County.  Tmax is the average of the daily maximum temperatures for the two-week period, and tmin is the average of the daily minimum temperatures. *Temperature data for December 2004 were not available from the Terrestrial Observation and Prediction System weather datasets
Figure 4.
Figure 4.
Summary of human cases, positive dead birds Culex quinquefasciatus abundance in females per trap night (F/TN) and infection incidence (maximum likelihood estimation [MLE]) reported in the Greater Los Angeles County Vector Control District during 2003–2008 by biweekly interval. *Mosquito infection incidence/1,000 mosquitoes was calculated biweekly by bias corrected MLE methods with skewness-corrected 95% confidence intervals using PooledInfRate software add-in.
Figure 5.
Figure 5.
Three study areas in Los Angeles County defined by the time-space scan results with mosquito and chicken surveillance sites.
Figure 6.
Figure 6.
Summary of dead birds tested in Los Angeles County during 2003–2008, reported as proportion tested (birds that were in a testable condition/total birds reported) and proportion positive (birds that tested positive/total tested birds).
Figure 7.
Figure 7.
Summary of house finch and house sparrow seroprevalence in Los Angeles County during 2004–2008 (number positive/total collected/month) compared with the counts of human cases and positive dead birds by monthly interval. Positive dead birds indicates virus detection in bird carcasses by reverse transcription–polymerase chain reaction and seroprevalence indicates detection of antibody to West Nile virus by enzyme immunoassay in live-captured house finches and house sparrows.

References

    1. Reisen W, Lothrop H, Chiles R, Madon M, Cossen C, Woods L, Husted S, Kramer V, Edman J. West Nile virus in California. Emerg Infect Dis. 2004;10:1369–1378. - PMC - PubMed
    1. Reisen WK, Lothrop HD, Chiles RE, Madon MB, Cossen C, Woods L, Husted S, Kramer VL, Edman JD. West Nile virus in California. Emerg Infect Dis. 2004;10:1369–1378. - PMC - PubMed
    1. Wilson J, Hazelrigg JE, Reisen WK, Madon MB. Invasion of Greater Los Angeles by West Nile virus - 2003. Proc Mosq Vector Control Assoc Calif. 2004;72:6–11.
    1. Reeves WC, Asman SM, Hardy JL, Milby MM, Reisen WK. Epidemiology and Control of Mosquito-borne Arboviruses in California, 1943–1987. Proc Mosq Vector Control Assoc Calif. 1990;71:17–27.
    1. Reisen WK, Milby MM, Presser SB, Hardy JL. Ecology of mosquitoes and St. Louis encephalitis virus in the Los Angeles Basin of California, 1987–1990. J Med Entomol. 1992;29:582–598. - PubMed

Publication types

MeSH terms