. 2010 Jan-Apr;14(1-2):23-32.

Cytotoxicity of subtoxic AgNP in human hepatoma cell line (HepG2) after long-term exposure

Affiliations

Cytotoxicity of subtoxic AgNP in human hepatoma cell line (HepG2) after long-term exposure

Azin Nowrouzi et al. Iran Biomed J. 2010 Jan-Apr.

Abstract

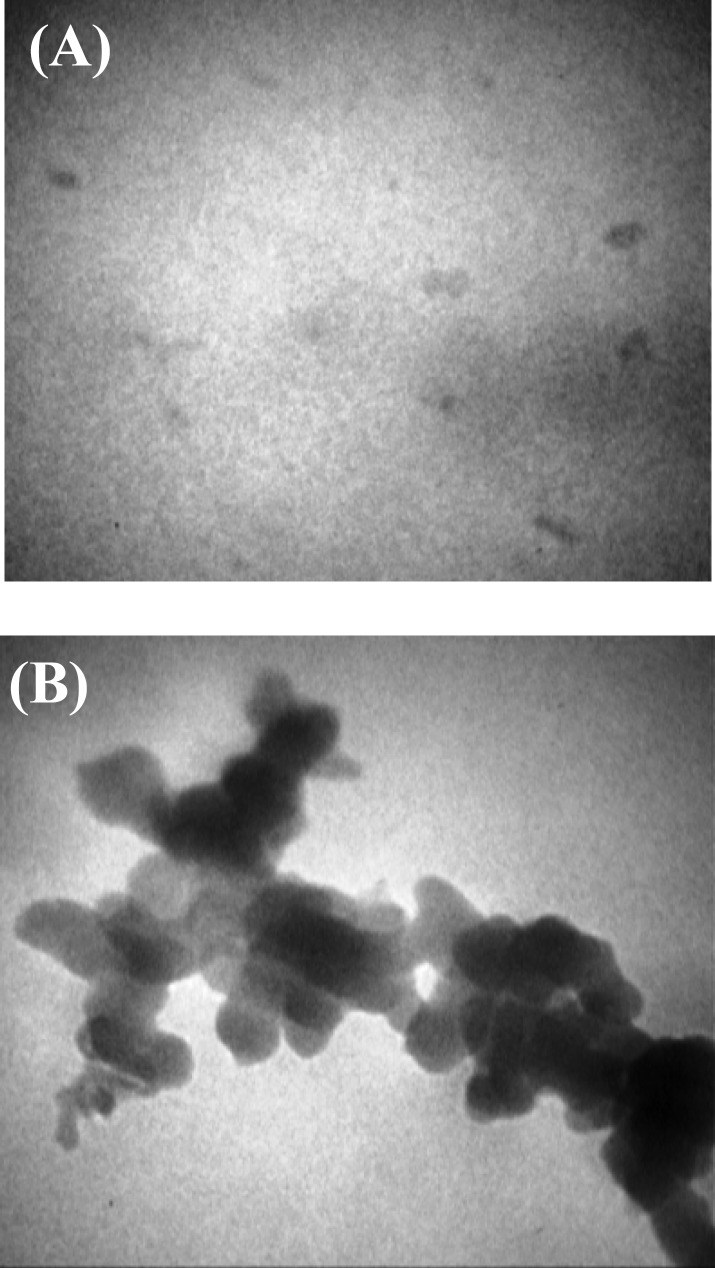
We aimed at evaluating the toxicity effects of low (subtoxic) concentrations of silver nanoparticles nanoparticles (AgNP, 5-10 nm) in human hepatoblastoma (HepG2) cell line after and during a period of about one month.

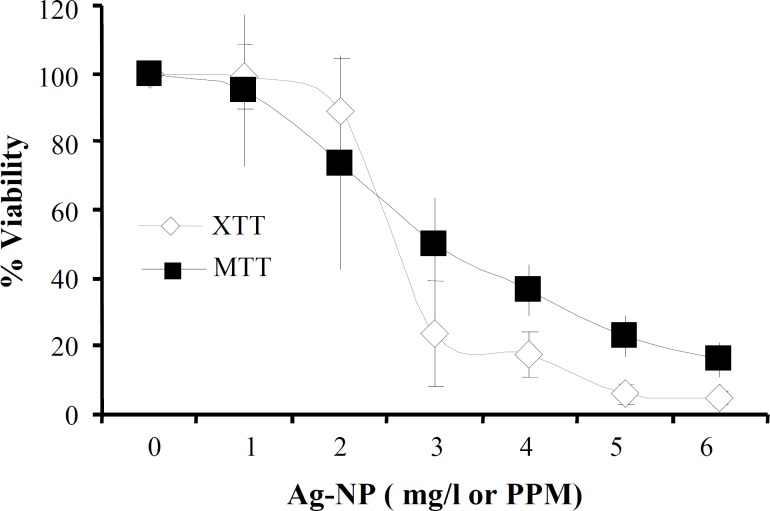
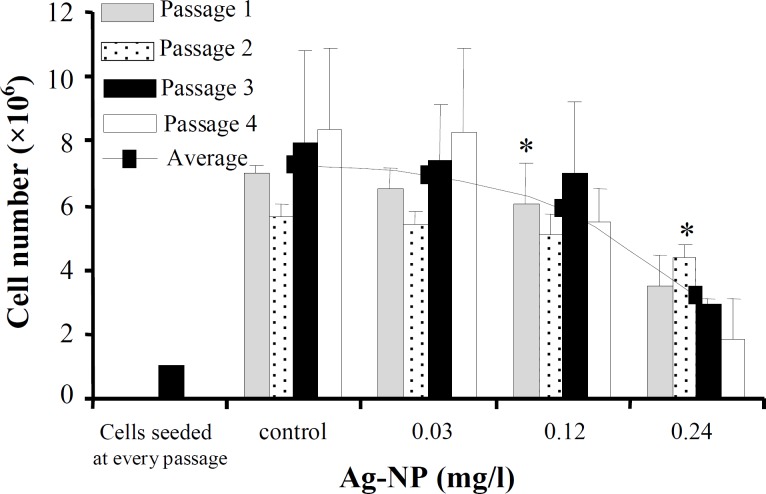
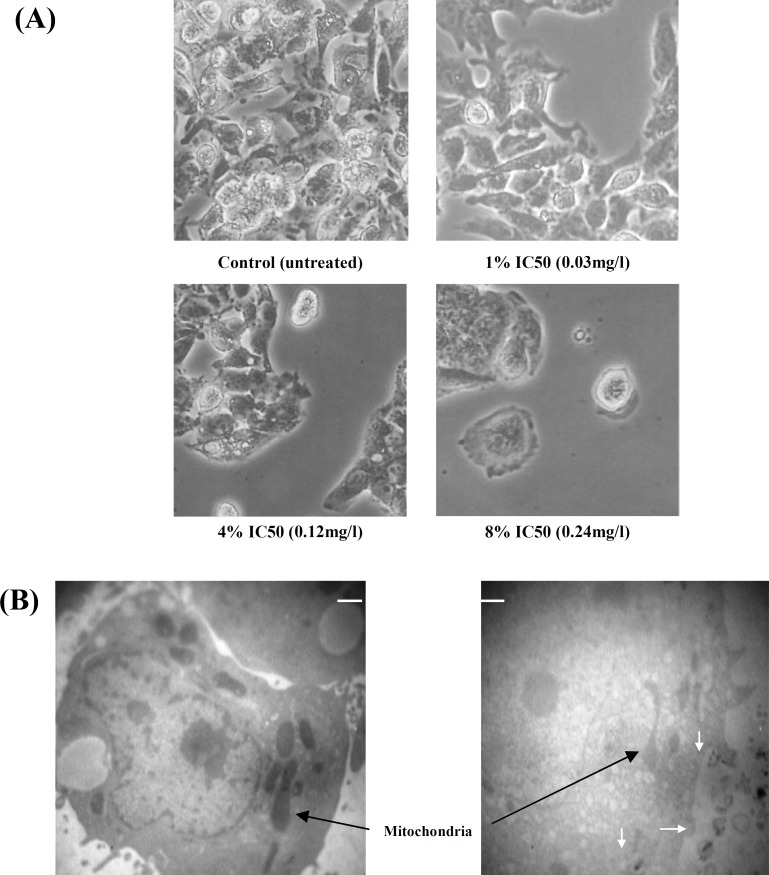
Methods: XTT and MTT assays were used to draw a dose-response curve; IC50 (half maximal inhibitory concentration) value of the AgNP on HepG2 cells was calculated to be 2.75-3.0 mg/l. The cells were exposed to concentrations of 0% (control), 1%, 4% and 8% IC50 of AgNP (corresponding to 0.00, 0.03, 0.12 and 0.24 mg/l of AgNP, respectively) for four consecutive passages. The treated cells were compared to the control group with respect to morphology and proliferation at the end of the period.

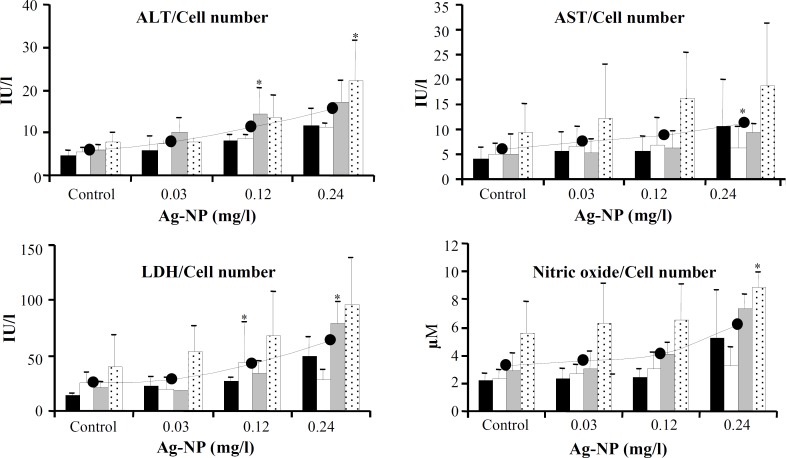
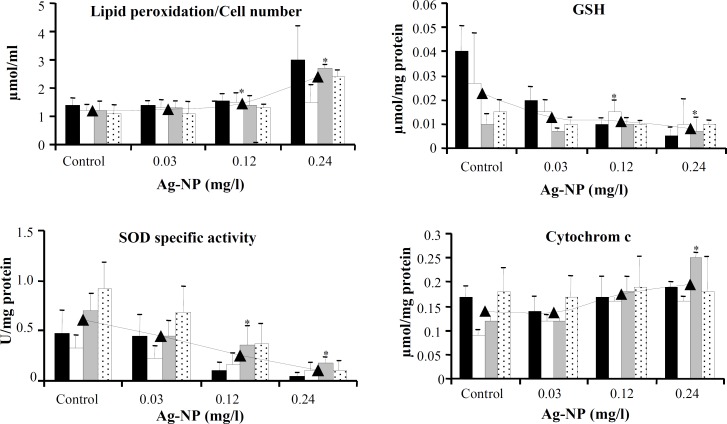
Results: The biochemical studies revealed significant increases of lactate dehydrogenase and alanine aminotransferase enzyme activity in the culture media of cells receiving 4% and 8% IC50; the increases in the aspartate aminotransferase enzyme activity and nitric oxide concentration became significant at 8% IC50. In the cell extracts, the average total protein and activity of glutathione peroxidase enzyme remained unchanged; the decrease in the average content of glutathione (GSH) and superoxide dismutase (SOD) activity became significant at 4% and 8% IC50. There were increases in lipid peroxidation (significant at 4% and 8% IC50) and cytochrome c content (significant at 8% IC50). The accumulations of the effects, during the experiment from one generation to the next, were not statistically remarkable except in cases of GSH and SOD. The results indicate clearly the involvement of oxidative changes in the cells after exposure to low doses of AgNP.

Conclusion: The results might help specify a safer amount of AgNP for use in different applications.


Figures

Fig. 1
Fig. 1
IC50 determination. Cell viability was measured by XTT and MTT assays on HepG2 cells after a 24 h exposure to increasing doses of AgNP. The data are expressed as mean   standard deviation of two independent experiments. An OD value of control cells was taken as 100% viability. The relative cell viability related to control was calculated by [OD]test/[OD]control   100. Using the dose-response curves, IC50 was calculated to be 2.75-3.0mg/l (ppm).
Fig. 2.
Fig. 2.
Cell viability under low doses of AgNP and with time. After seeding in eight 75 cm flasks, the cells (1   106) were allowed to adhere. AgNP were added to duplicate flasks to reach final concentrations of 1%, 4%, and 8% IC50 value corresponding to 0.03, 0.12, and 0.24 mg/l, respectively. When the control flasks approached 70-80% confluent, the cells in all of the flasks were detached. After a total cell count, another batch of 1   106 cells was reseeded in new flasks, the rest was washed twice with PBS and kept frozen. Although an equal number of cells was seeded at every cell culture renewal (1   106), cells of the group receiving 0.24 mg/l could not proliferate quickly enough to fill the flasks during the same time period that the control flask reached its confluence. Data are expressed as mean   SD of two duplicate experiments. * indicates a statistically significant difference relative to the control at 0.12 mg/l (P<0.05) and 0.24 mg/l (P<0.0001).
Fig. 3
Fig. 3
Morphological characterization of HepG2 cells. (A) Four groups of cells, control and those treated with three different concentrations of AgNP (0.03, 0.12, and 0.24 mg/l) were visualized by inverted microscope at the end of final exposure (magnification  32). (B) Two flasks of HepG2 cells (one control and one test) were prepared. The test cells were treated with 1 mg/l of AgNP for 12 h. Both the untreated and the treated cells were trypsinized, washed with PBS and processed for TEM. Despite apparently intact membranes, the cytoplasmic features and organelles of the treated cells including mitochondria are remarkably different from those of control cells. (Scale marker indicates 2500 nm,  3000). Clusters of AgNP are present both inside and outside of the cell (white arrows).
Fig. 4
Fig. 4
Effect of AgNP on ALT, AST, LDH, and NO levels measured in culture media of unexposed control cells and cells exposed to 0.03, 0.12, and 0.24 mg/l of AgNP. The values were obtained using their respective assay kits, corrected according to the volume of culture media, and further normalized by considering the total cell number at the end of each generation. Data are expressed as mean   SD of two duplicate experiments. *indicates a statistically significant difference compared to the control. Within each dose group, among generations one to four, the differences were not statistically significant. first exposure, second exposure, third exposure, fourth exposure and average.
Fig. 5.
Fig. 5.
Effect of AgNP on the levels of lipid peroxidation, total GSH, SOD activity and cytochrome c measured in cell extracts. Cells (control and treated with 0.03, 0.12, and 0.24 mg/l of AgNP) were homogenized for one hour on ice in a solution containing 5 mM PMSF. Measurements were done as described in the method section. The data are normalized by dividing each value by the protein content of its respective cell extract. Lipid peroxidation values were divided by cell numbers. Data are expressed as mean   SD of two duplicate experiments. * denotes a statistically significant difference compared to the control (P<0.05). first exposure, second exposure, third exposure, fourth exposure and average
Fig. 6
Fig. 6
Characterization of AgNP. A drop of the original solution was placed on a carbon-coated copper grid, air dried, and observed with ZIESS electron microscope (EM902A) at 80KV. Pictures (A) spherical around 10 nm, and (B) agglomerated structures above 150, were taken from different areas of one single grid. Most of the grid was covered with agglomerations. (Scale markers indicate 50 nm ( 140000) and 150 nm ( 50000), respectively.

References

    1. Kreuter J. Nanoparticles-a historical perspective. Int J Pharm. 2007;331(1):1–10. - PubMed
    1. Maynard A D, Aitken R J, Butz T, Colvin V, Donaldson K, Oberdorster G, Philbert M A, Ryan J, Seaton A, Stone V, Tinkle S S, Tran L, Walker N J, Warheit D B. Safe handling of nanotechnology. Nature. 2006;444(7117):267–269. - PubMed
    1. Chen X, Schluesener H J. Nanosilver: a nanoproduct in medical application. Toxicol Lett . 2008;176(1):1–12. - PubMed
    1. Panyala N R, Pena-Mendez E N, Havel J. Silver or silver nanoparticles: a hazardous threat to the environment and human health. J Appl Med. 2008;6:117–129.
    1. Silver S, Phung le T, Silver G. Silver as biocides in burn and wound dressings and bacterial resistance to silver compounds. J Ind Microbiol Biotechnol. 2006;33(7):627–634. - PubMed

Publication types

LinkOut - more resources