

Focal splenic lesions in type I Gaucher disease are associated with poor platelet and splenic response to macrophage-targeted enzyme replacement therapy
- PMID: 20683668
- PMCID: PMC3008694
- DOI: 10.1007/s10545-010-9175-6
Focal splenic lesions in type I Gaucher disease are associated with poor platelet and splenic response to macrophage-targeted enzyme replacement therapy
Abstract
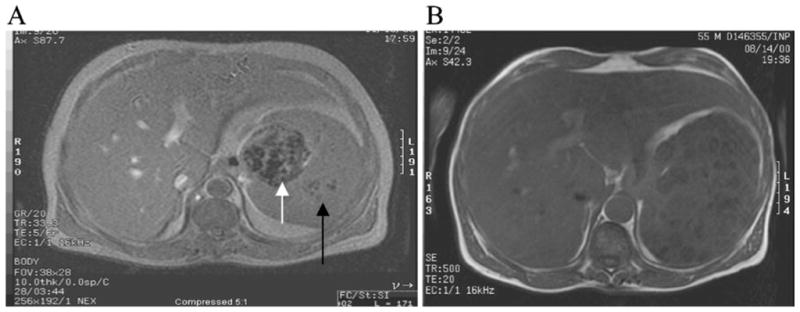
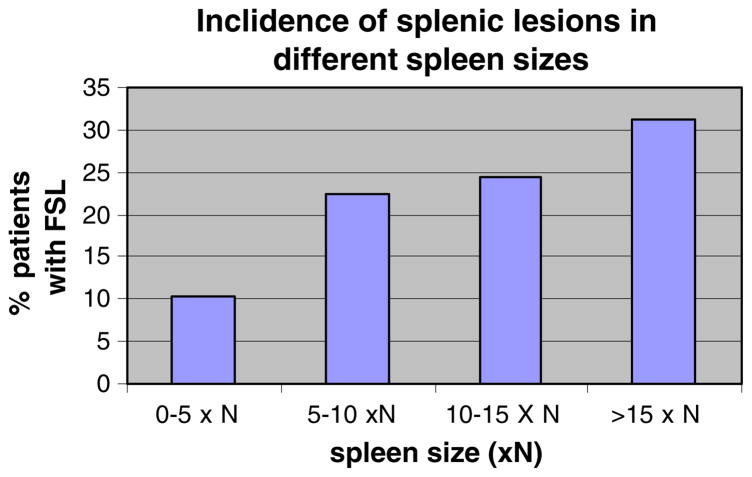
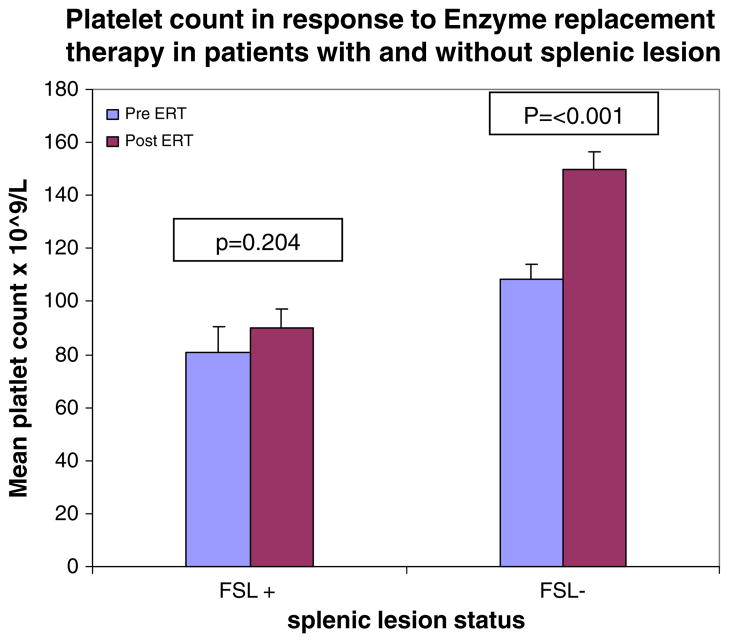
Focal splenic lesions (FSL) occur in Gaucher disease type I (GD1), but their clinical significance is not known. Previous studies estimated the prevalence of FSL at 4% (pediatric) to 33% (adult) of GD1 patients and reported an association with splenomegaly. We tested the hypothesis that the presence of FSL is associated with suboptimal response to macrophage-directed enzyme replacement therapy (ERT). Additionally we investigated whether FSL were associated with other phenotypic features of GD1. The splenic parenchyma was assessed by MRI performed for routine evaluation of GD1 in 239 consecutive GD1 patients with intact spleens. The prevalence of FSL was 18.4% (44/239). Following a mean of 3.5 years of ERT, platelet response was inferior among patients with FSL (80,700 ± 9,600 to 90,100 ± 7,200/mm(3) , P = 0.2) compared to patients without FSL in whom there was a robust platelet response: 108,600 ± 5,670 to 150,200 ± 6,710/mm(3), P < 0.001. Compared to patients without FSL, patients harboring FSL had worse thrombocytopenia (platelet count: 83,700 ± 8,800 vs. 112,100 ± 4,200/mm(3), P = 0.004), greater frequency of pre-ERT splenomegaly, and greater post-ERT splenomegaly (8.5 ± 0.77 vs. 4.8 ± 0.25× normal, P < 0.001). Additionally, the prevalence of osteonecrosis was higher among patients with FSL compared to patients without FSL (38 vs. 20.7%, P = 0.026). FSL appear to be a determinant of response to ERT, suggesting studies comparing relative efficacy of newly emerging therapies for GD1 should adjust for this factor. Moreover, occurrences of FSL coincide with more severe manifestations of GD1 such as avascular osteonecrosis.
Conflict of interest statement
Competing interests: None declared
Figures
Similar articles
-
Splenic nodules in paediatric Gaucher disease treated by enzyme replacement therapy.Pediatr Radiol. 2008 Jun;38(6):657-60. doi: 10.1007/s00247-008-0811-3. Epub 2008 Apr 1. Pediatr Radiol. 2008. PMID: 18379770
-
[A retrospective study on enzyme replacement therapy in patients with Gaucher disease].Zhonghua Er Ke Za Zhi. 2006 Sep;44(9):653-6. Zhonghua Er Ke Za Zhi. 2006. PMID: 17217655 Chinese.
-
Characteristics of type I Gaucher disease associated with persistent thrombocytopenia after treatment with imiglucerase for 4-5 years.Br J Haematol. 2012 Aug;158(4):528-38. doi: 10.1111/j.1365-2141.2012.09175.x. Epub 2012 May 29. Br J Haematol. 2012. PMID: 22640238
-
Velaglucerase alfa for the management of type 1 Gaucher disease.Clin Ther. 2012 Feb;34(2):259-71. doi: 10.1016/j.clinthera.2011.12.017. Epub 2012 Jan 20. Clin Ther. 2012. PMID: 22264444 Review.
-
Taliglucerase alfa: an enzyme replacement therapy using plant cell expression technology.Mol Genet Metab. 2014 May;112(1):1-8. doi: 10.1016/j.ymgme.2014.02.011. Epub 2014 Mar 2. Mol Genet Metab. 2014. PMID: 24630271 Review.
Cited by
-
Achievement of therapeutic goals with low-dose imiglucerase in Gaucher disease: a single-center experience.Adv Hematol. 2013;2013:151506. doi: 10.1155/2013/151506. Epub 2013 Oct 28. Adv Hematol. 2013. PMID: 24285960 Free PMC article.
-
A reappraisal of Gaucher disease-diagnosis and disease management algorithms.Am J Hematol. 2011 Jan;86(1):110-5. doi: 10.1002/ajh.21888. Am J Hematol. 2011. PMID: 21080341 Free PMC article.
-
Long-term efficacy and safety results of taliglucerase alfa up to 36 months in adult treatment-naïve patients with Gaucher disease.Am J Hematol. 2016 Jul;91(7):656-60. doi: 10.1002/ajh.24369. Epub 2016 Apr 24. Am J Hematol. 2016. PMID: 27174694 Free PMC article. Clinical Trial.
-
Clinical outcomes after 4.5 years of eliglustat therapy for Gaucher disease type 1: Phase 3 ENGAGE trial final results.Am J Hematol. 2021 Sep 1;96(9):1156-1165. doi: 10.1002/ajh.26276. Epub 2021 Jul 11. Am J Hematol. 2021. PMID: 34161616 Free PMC article. Clinical Trial.
-
Very rare condition of multiple Gaucheroma: A case report and review of the literature.Mol Genet Metab Rep. 2019 Jul 12;20:100489. doi: 10.1016/j.ymgmr.2019.100489. eCollection 2019 Sep. Mol Genet Metab Rep. 2019. PMID: 31341788 Free PMC article.
References
-
- Barton NW, Brady RO, Dambrosia JM, et al. Replacement therapy for inherited enzyme deficiency—macrophage-targeted glucocerebrosidase for Gaucher’s disease. N Engl J Med. 1991;324:1464–1470. - PubMed
-
- Charrow J, Esplin JA, Gribble TJ, et al. Gaucher disease: recommendations on diagnosis, evaluation, and monitoring. Arch Intern Med. 1998;158:1754–60. - PubMed
-
- Chatelain D, Bralet MP, Brière J, et al. Multiple splenic nodules revealing Gaucher’s disease. Histopathology. 2002;40:203–4. - PubMed
-
- Chippington S, McHugh K, Vellodi A. Splenic nodules in paediatric Gaucher disease treated by enzyme replacement therapy. Pediatr Radiol. 2008;38:657–60. - PubMed
Publication types
MeSH terms
Substances
Grants and funding
LinkOut - more resources
Full Text Sources
Medical
