. 2011 Nov;21(11):1190-215.
doi: 10.1002/hipo.20828. Epub 2010 Aug 3.

Pattern separation in the dentate gyrus: a role for the CA3 backprojection

Affiliations

Pattern separation in the dentate gyrus: a role for the CA3 backprojection

Catherine E Myers et al. Hippocampus. 2011 Nov.

Abstract

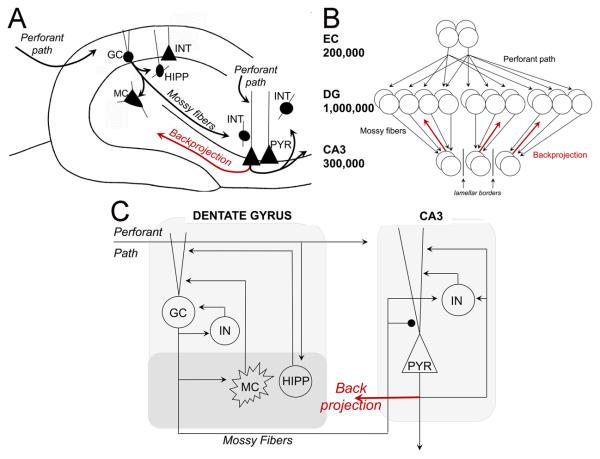
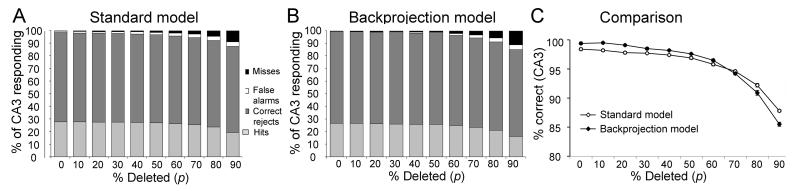
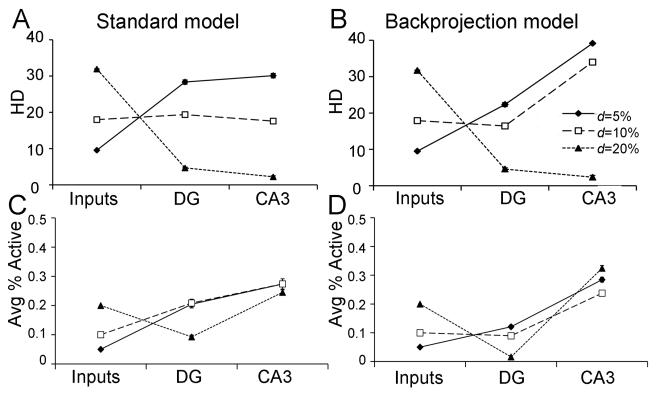
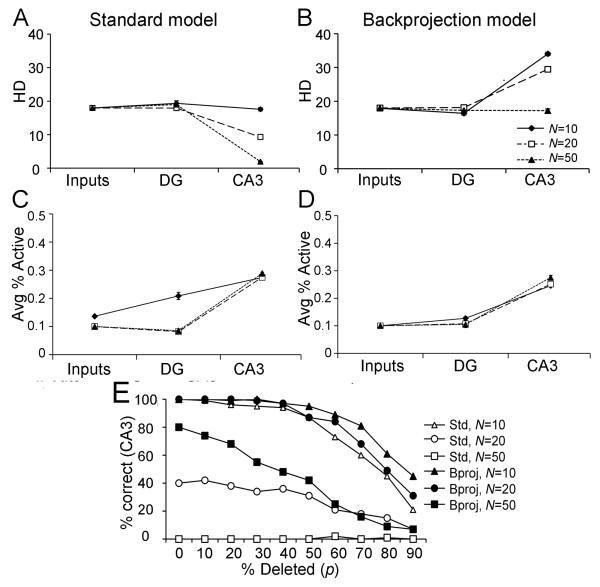
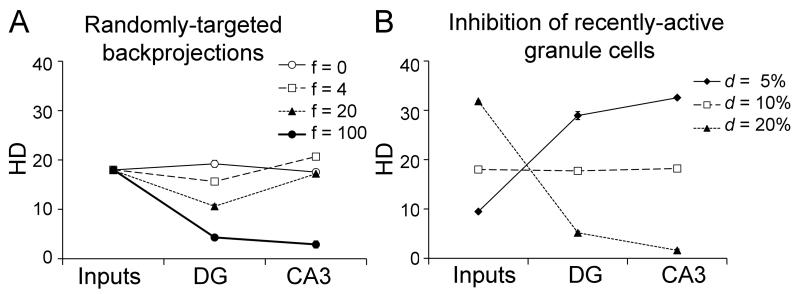
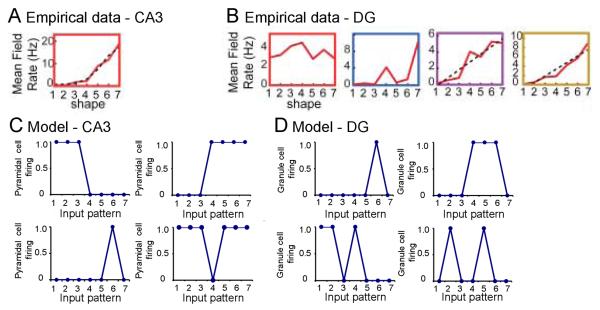
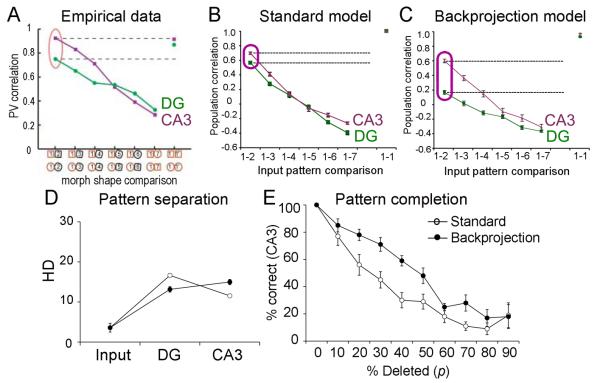
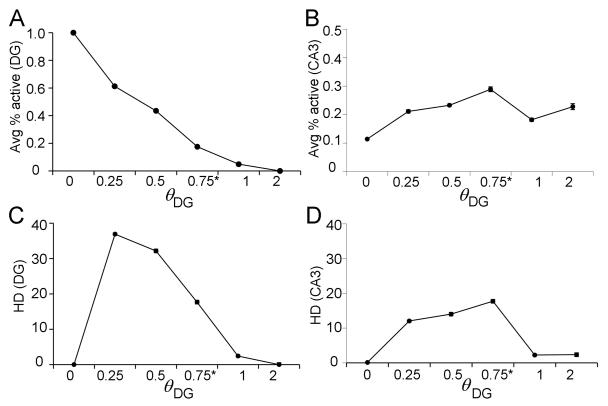
Many theories of hippocampal function assume that area CA3 of hippocampus is capable of performing rapid pattern storage, as well as pattern completion when a partial version of a familiar pattern is presented, and that the dentate gyrus (DG) is a preprocessor that performs pattern separation, facilitating storage and recall in CA3. The latter assumption derives partly from the anatomical and physiological properties of DG. However, the major output of DG is from a large number of DG granule cells to a smaller number of CA3 pyramidal cells, which potentially negates the pattern separation performed in the DG. Here, we consider a simple CA3 network model, and consider how it might interact with a previously developed computational model of the DG. The resulting "standard" DG-CA3 model performs pattern storage and completion well, given a small set of sparse, randomly derived patterns representing entorhinal input to the DG and CA3. However, under many circumstances, the pattern separation achieved in the DG is not as robust in CA3, resulting in a low storage capacity for CA3, compared to previous mathematical estimates of the storage capacity for an autoassociative network of this size. We also examine an often-overlooked aspect of hippocampal anatomy that might increase functionality in the combined DG-CA3 model. Specifically, axon collaterals of CA3 pyramidal cells project "back" to the DG ("backprojections"), exerting inhibitory effects on granule cells that could potentially ensure that different subpopulations of granule cells are recruited to respond to similar patterns. In the model, addition of such backprojections improves both pattern separation and storage capacity. We also show that the DG-CA3 model with backprojections provides a better fit to empirical data than a model without backprojections. Therefore, we hypothesize that CA3 backprojections might play an important role in hippocampal function.


Figures

Figure 1
Figure 1
Characteristics of the standard DG-CA3 model and its modification by addition of backprojections. (A) Simplified schematic of the DG and CA3 circuitry. The perforant path innervates distal dendrites of multiple cell types in the DG and CA3. Granule cell axons (the mossy fibers) project to neurons with dendrites in the hilus (interneurons and mossy cells) and neurons in CA3. Various interneurons exist throughout both areas, and only a subset is shown. Pyramidal cells have a complex projection which targets other CA3 cells via recurrent collaterals, CA1 cells by the Schaffer collaterals, and the contralateral hippocampus. They also send a collateral to the DG via the hilus (backprojection; red). B) In the rat, about 200,000 entorhinal layer II cells project to about 1 million granule cells (Amaral et al., 1990), so that information from entorhinal cortex “diverges” onto a larger number of granule cells; in general, this increases the sparseness of the representation and facilitates pattern separation. But, in the next step, information from the large granule cell layer “converges” onto a smaller number of CA3 pyramidal cells, so that -- in general -- information is re-compressed and some pattern separation would be lost. The mossy fiber pathway from DG to CA3 is predominantly confined within the lamellae of the granule cells of origin (i.e., it is lamellar), further reducing the ability of information from the DG to spread out across a large population of CA3 cells. Thus, anatomical information suggests that there should be some mechanism(s) to allow the pattern separation achieved in DG to be preserved in the transfer to CA3. We suggest that backprojections from CA3 to the DG (red arrows) may be one such mechanism. (C) Schematic of the “standard” DG/CA3 model, incorporating the DG model of Myers & Scharfman (2009) as well as a simple CA3 network that reflects the fundamental characteristics of CA3 circuitry shown in (A). For simplicity, the diagram only shows one of each cell type, and only one lamella. In the “backprojection” model, backprojections from CA3 to the DG (red arrow) are added to the “standard” model, with the simple assumption that pyramidal cells influence the same granule cells that target them, and that these backprojections are sufficient to temporarily silence granule cells. GC=granule cell; INT=interneuron, representing basket cells and other GABAergic neurons; MC=hilar mossy cell; HIPP=hilar interneuron receiving input from the perforant path, PYR=CA3 pyramidal cell. Strong synapses (from mossy fibers onto PYR) are indicated by large black circle; other synapses are indicated by arrowheads.
Figure 2
Figure 2
Pattern completion performance in the standard DG-CA3 model (A) and backprojection model (B), after training on 10 input patterns with input density d=10% (where d is the percent of entorhinal inputs that are active – firing – in each input pattern). Subsequently the model is tested using modified input patterns in which a percentage (p) of active elements is deleted. The performance of the model is evaluated as the percentage of CA3 pyramidal cells showing Hits (gray; active in both stored and retrieved pattern), Correct Rejects (dark gray; active in neither stored nor retrieved pattern), Misses (black; active in stored but not retrieved pattern), or False Alarms (white; active in retrieved but not stored pattern). For p<50%, pattern completion is excellent (mostly Hits and Correct Rejects, with very few Misses or False Alarms). Even at p=90%, more than 85% of the trained patterns are correctly reconstructed. (C) Overall percent correct on the pattern completion task, defined as total Hits plus Correct Rejects, does not differ significantly between the standard and backprojection models. For this figure and following ones, statistical comparisons are presented in the text.
Figure 3
Figure 3
Pattern separation behavior in the standard DG-CA3 model (A) and the backprojection model (B). For a set of 10 patterns, where d=5%, the DG network performs pattern separation, reflected by increased HD of granule cell output relative to that the EC input; in the standard model, the pattern separation obtained in the DG is maintained in CA3, but in the backprojection model, there is actually an increase in pattern separation in CA3 relative to that obtained in DG. As d increases to 10%, DG preprocessing produces no increase in HD in CA3 of the standard model, but does produce good pattern separation in CA3 of the backprojection model. Only as d increases to 20% does DG preprocessing actually reduce pattern separation in CA3 in both the standard and the backprojection model. (C,D) Activity levels in the DG and CA3 network, as the average percent of granule or pyramidal cells that are active, also varies with d; in general, there is less DG activity in the backprojection model than in the standard model, which could be due to the inhibitory influence of backprojections on granule cells.
Figure 4
Figure 4
Effect of the number of patterns stored on pattern separation in the standard (A) and backprojection (B) models, trained on a set of N randomly-constructed patterns where d=10%. (A) When N=10, the degree of pattern separation in the standard model (defined by HD) in DG and in CA3 is comparable to that already present in the entorhinal inputs. As the number of stored patterns increases from N=10 to N=20 or N=50, HD in CA3 of the standard model decreases greatly. (B) In contrast, the backprojection model shows pattern separation at both N=10 and N=20; even at N=50, HD in CA3 is no lower than that of the inputs. (C,D) For both the standard and backprojection models, activity in the DG and CA3 networks, expressed as the average percent of granule or pyramidal cells that are active, is largely constant as N increases, although there is a higher level of DG activity in the standard model for low numbers of patterns (N=10). (E) Effect of N on pattern retrieval and pattern completion in the standard and backprojection models. For N=10, the standard model can reliably retrieve a stored pattern when presented with the complete input pattern (percent deletion p=0%); as increasing percentages of the input pattern are deleted, performance degrades gradually until, at p=90%, CA3 retrieves the correct stored pattern only about 20% of the time. For N=20 stored patterns, the standard model is not always able to retrieve the correct stored pattern even with p=0% deletion, and for N=50, pattern storage and completion fail completely. Thus, the storage capacity of the standard DG-CA3 model for randomly-constructed patterns at d=10% is only between 10 and 20 patterns. In contrast, the backprojection model is able to store and retrieve N=20 patterns, and even for N=50 patterns, it is still able to store and reconstruct some patterns as long as percent deletion p is low.
Figure 5
Figure 5
Alternate implementations of the backprojection. (A) Pattern separation in a model variant where CA3 backprojections provide random inhibition to f randomly-chosen granule cells. If f=0, this is equivalent to the standard model with no backprojections. When f=4 (the same number as in the backprojection model), there is little effect of randomly-targeted backprojections on pattern separation. At higher values of f, widespread inhibition actually decreases pattern separation in the DG and eventually in CA3. (B) If inhibition targets all recently-active granule cells, either by diffusely-targeted backprojections or by other local mechanisms, there is little effect on pattern separation compared to the standard model (compare Figure 3A). Thus, the improved pattern separation seen in the backprojection model reflects not just diffusely or randomly-targeted inhibition, but rather selective inhibition of particular groups of granule cells.
Figure 6
Figure 6
Evaluation of the DG-CA3 computational model relative to empirical data (A). In rodents that were exposed to seven environments that initially resembled a square and gradually changed to a circle (progressively modified or “morphed” environments labeled 1 to 7), CA3 place cells typically showed a single place field, and firing rate gradually changed as the environment morphed. The example shown illustrates that a CA3 cell fired strongly in a particular region of environment 7, less strongly in the corresponding region of environment 6, and progressively more weakly in environments 5 through 1. Adapted from Leutgeb et al. (2007), Figure 2C. (B) In contrast to CA3, place fields in cells of the DG (presumed granule cells) often showed multiple place fields, and there were large differences in firing rate even if there was little difference in the environment. The example shown is from a DG cell that showed four place fields. The first (red) is a place field in a particular region of environment 1, and the cell responded in the corresponding region of all the other environments (2 through 7) also. The cell showed two additional place fields (purple, yellow) in other regions of environment 7, and its responses gradually decreased in environments that were progressively less similar to environment 7. This same cell showed a fourth place field (blue) in a different region of environment 7, and also fired strongly in that same region of environment 4 – but not in the corresponding regions of environments 1, 2, 5, or 6. Adapted from Leutgeb et al. (2007), Figure 2C. (C) CA3 pyramidal cells in the standard DG-CA3 model tended to show similar responses to similar input patterns. Four examples are shown. Top: firing rate of two cells that each responded strongly to several similar input patterns (I1, I2, and I3; or I4, I5, I6, and I7). Bottom: firing rates of two cells that responded either to a single input pattern, or to all but a single input pattern. Data from the backprojection model (not shown) were similar. (D) Granule cells in the standard DG-CA3 model often showed strong responses to two or more input patterns. Four examples are shown. In some cases (top), cells showed responses only to a single input pattern, or to several similar input patterns. But in other cases, cells responded strongly to distinct input patterns (e.g. I1, I2, and I5; or I2 and I5). Such nonmonotonicity of firing patterns is similar to that observed empirically in granule cells (e.g., part B, blue). Data from the backprojection model (not shown) were similar.
Figure 7
Figure 7
The backprojection model a better qualitative fit to empirical data than does the standard DG-CA3 model. (A) In vivo, rodents that were exposed to progressively “morphed” environments 1 to 7, as described in Figure 5, were evaluated with electrodes in CA3 or the DG. CA3 pyramidal neurons showed a smooth decline in population correlation as environments gradually changed. In contrast, there was a much lower population correlation for presumed dentate granule cells for environments that were similar (e.g. 1 vs. 2). Adapted from Leutgeb et al. (2007) Figure 3A. (B) In the standard DG-CA3 model, population correlations in the DG appeared similar to those observed in CA3, which is inconsistent with the empirical data shown in (A). (C) In the backprojection model, the population correlation for similar environments (e.g. I1 vs. I2) was lower in DG than in CA3; this is similar to the empirical data shown in (A). (D) On a set of N=10 such highly-correlated patterns, pattern separation defined as decreased HD in CA3 is greater in the backprojection than in the standard model. (E) After training on a set of N=10 highly-correlated patterns, the backprojection model is better than the standard model at retrieving progressively more distorted versions of the trained inputs.
Figure 8
Figure 8
Evaluation of free parameters in the DG model: granule cell threshold (θDG). θDG is a free parameter representing granule cell threshold: the amount of depolarization required for a granule cell to fire an action potential (spike). As θDG rises, the number of granule cells responding to entorhinal input falls (A) and pattern separation in the DG is reduced (C). There is little effect of θDG on the overall level of CA3 pyramidal cell activity (B), but moderate values of θDG produce better pattern separation in CA3 than very low values (0) or very high values (≥1) of θDG (D).
Figure 9
Figure 9
Evaluation of free parameters in the computational model: resting potential, inhibition, and CA3 firing threshold. (A) Network performance, in terms of pattern completion behavior (1) and average number of CA3 pyramidal cells that spike in response to an input pattern (2), is relatively constant across a range of values of Vrest, the pyramidal cell resting potential. (B) Low values of inhibitory modulation γIN produce good pattern completion (1) but allow too many CA3 pyramidal cells to spike at once (2); high values produce chaotic behavior, with all pyramidal cells rhythmically silenced or disinhibited (as shown here). (C) As the firing threshold for CA3 pyramidal cells θCA3 increases, both pattern completion (1) and the number of CA3 pyramidal cells spiking in response to an input (2) decline gradually.
Figure 10
Figure 10
Evaluation of free parameters in the computational model: learning rates ηEC–CA3 for connections from perforant path inputs to pyramidal cells and ηCA3–CA3 for connections from CA3 pyramidal cells to other pyramidal cells. (A) Pattern completion behavior (1) is relatively stable across a range of learning rates, within the range 0<ηEC–CA3≤2; activity level in CA3 pyramidal cells (2) is also relatively constant unless ηEC–CA3 is very high, in which case EC-CA3 weights grow strong enough to overcome local inhibition, and most CA3 pyramidals respond to most inputs. (B) Similarly, pattern completion behavior (1) is optimal for an intermediate value of ηCA3–CA3 and there is little effect of this parameter on CA3 activity levels (2).
Figure 11
Figure 11
Evaluation of free parameters in the computational model: mossy fiber input to CA3. (A) The effect of varying the influence of mossy fiber inputs on pyramidal cells, γMF–pyr, is modest on pattern completion (1) and on number of spiking pyramidal cells (2), but very low values (3) have a deleterious effect on pattern separation in CA3, calculated as HD across the output to a set of 10 trained patterns. (B) Similarly, the effect of varying the influence of mossy fiber inputs on CA3 interneurons (γMF–IN) is modest on pattern completion (1) and on number of spiking pyramidal cells (2), but pattern separation is impaired if γMF–IN grows too high (3).

Similar articles

Cited by

References

    1. Acsády L, Kamondi A, Sík A, Freund T, Buzsáki G. GABAergic cells are the major postsynaptic targets of mossy fibers in the rat hippocampus. J Neurosci. 1998;18:3386–3403. - PMC - PubMed
    1. Alle H, Geiger JR. Combined analog and action potential coding in hippocampal mossy fibers. Science. 2006;311:1290–1293. - PubMed
    1. Amaral DG, Ishizuka N, Claiborne B. Neurons, numbers and the hippocampal network. In: Storm-Mathisen J, Zimmer J, Ottersen OP, editors. Understanding the brain through the hippocampus. Elsevier Science; New York, NY: 1990. pp. 1–11. - PubMed
    1. Amaral DG, Lavenex P. Hippocampal neuroanatomy. In: Andersen P, Morris R, Amaral D, Bliss T, O'Keefe J, editors. The Hippocampus Book. Oxford University Press; Oxford, UK: 2007. pp. 37–114.
    1. Amaral DG, Witter MP. The three-dimensional organization of the hippocampal formation: A review of anatomical data. Neuroscience. 1989;31:571–591. - PubMed

Publication types

MeSH terms