. 2011 Jan;26(1):193-208.
doi: 10.1002/jbmr.205.

WISP-1/CCN4 regulates osteogenesis by enhancing BMP-2 activity

Affiliations

WISP-1/CCN4 regulates osteogenesis by enhancing BMP-2 activity

Mitsuaki Ono et al. J Bone Miner Res. 2011 Jan.

Abstract

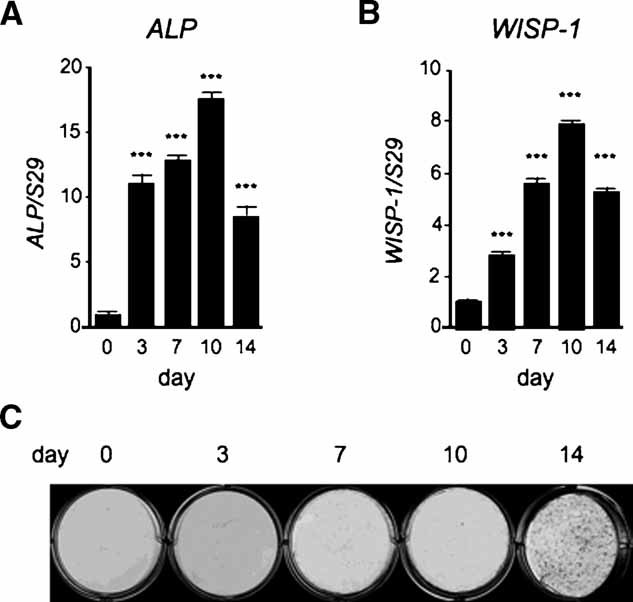
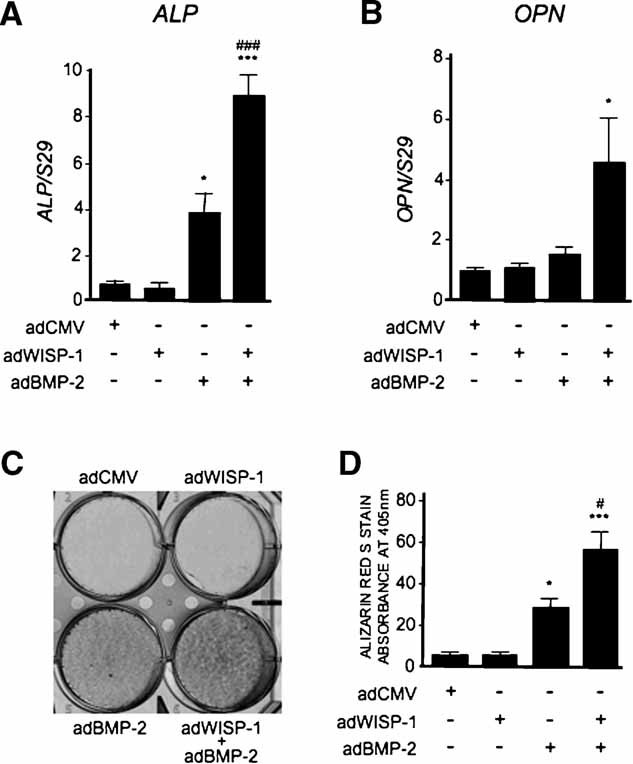
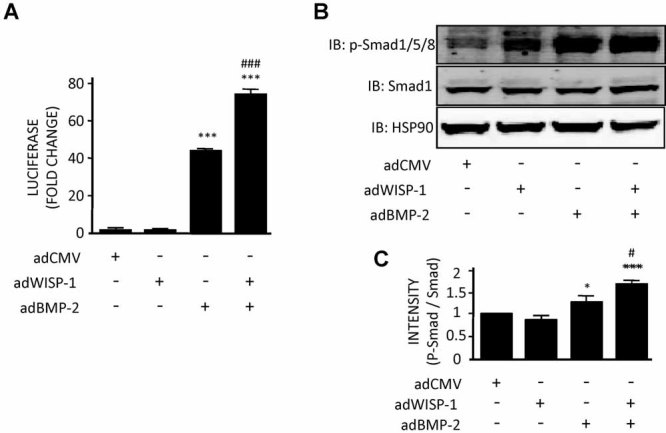
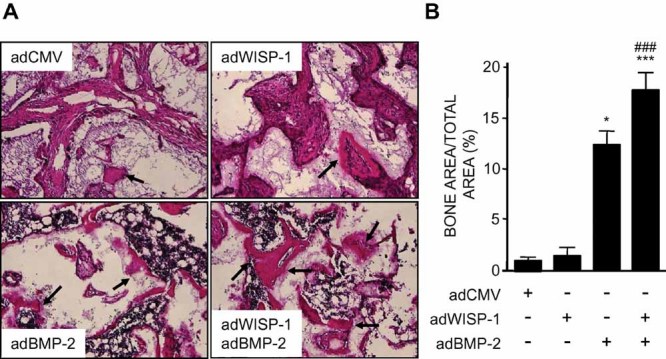
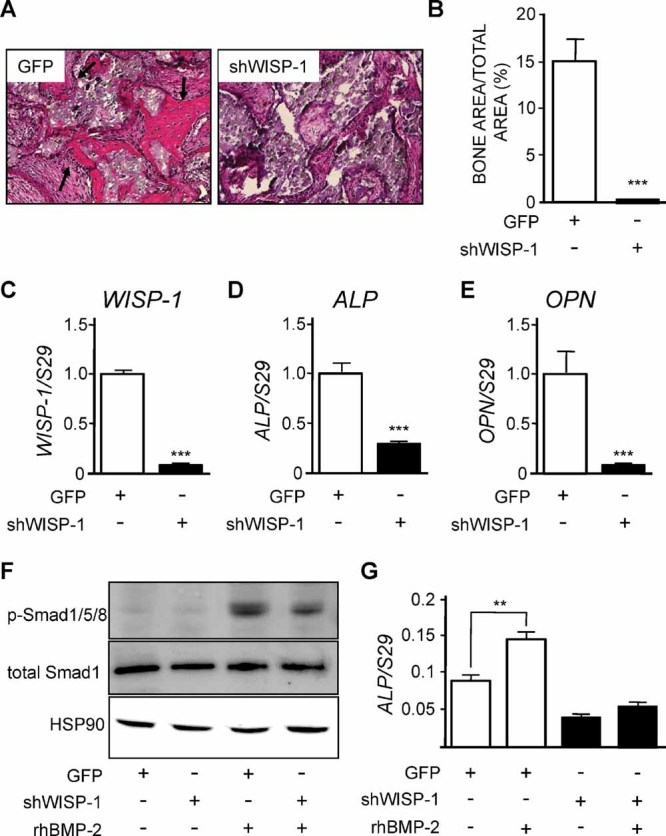
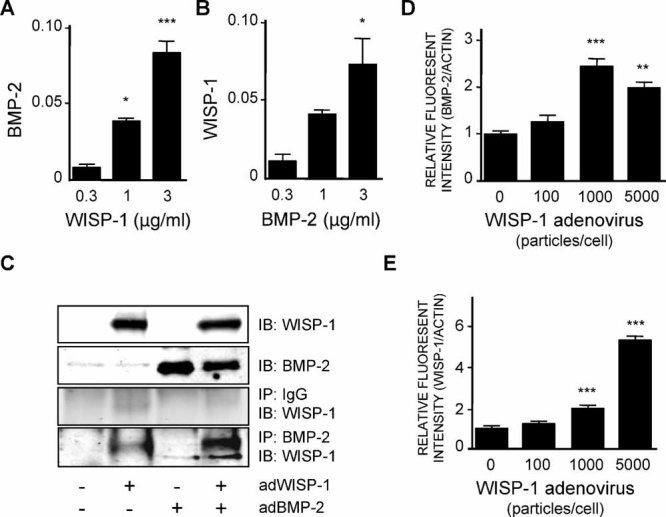
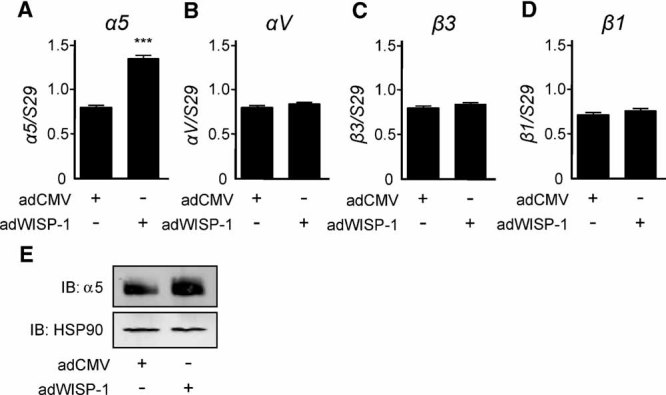
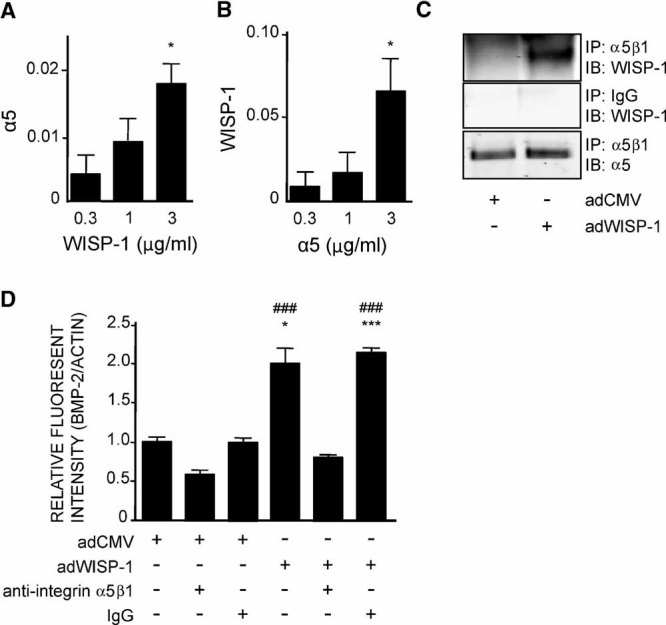
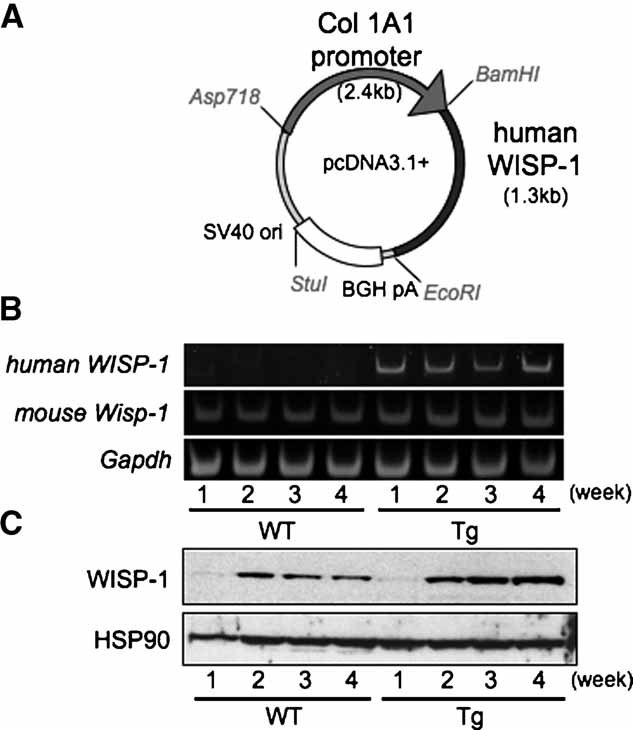
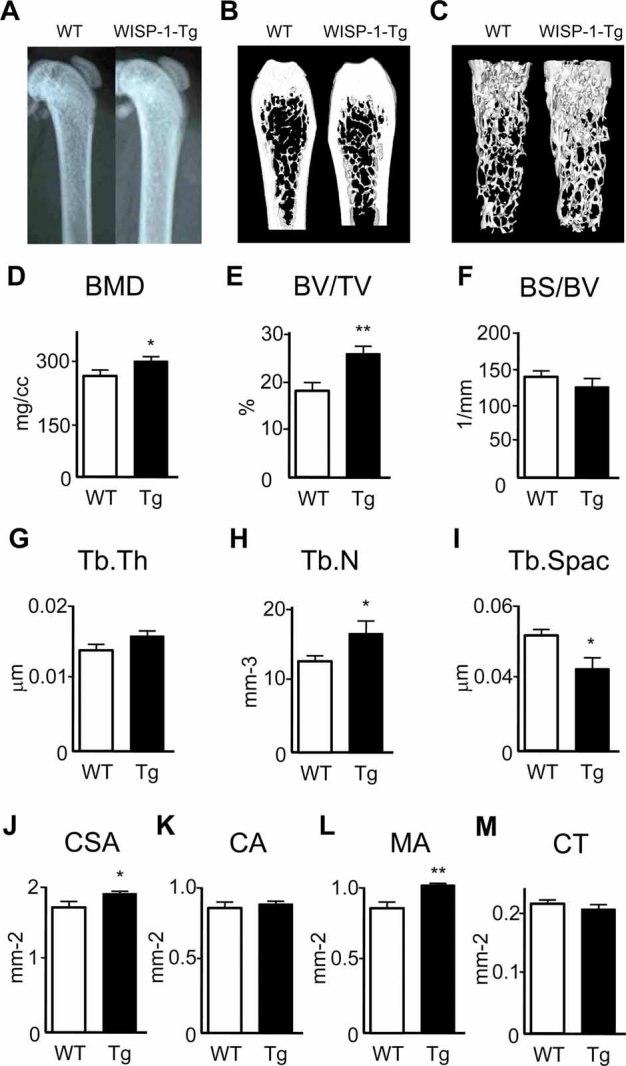
Wnt-induced secreted protein 1 (WISP-1/CCN4) is a member of the CCN family that is highly expressed in skeletal tissue and in osteoprogenitor cells induced to differentiate in vitro. To determine the function of WISP-1 during osteogeneis, osteogenic bone marrow stromal cells (BMSCs) were transduced with WISP-1 adenovirus (adWISP-1) in the presence or absence of bone morphogenetic protein 2 (BMP-2) adenovirus (adBMP-2). WISP-1 overexpression enhanced the ability of BMP-2 to direct BMSCs toward osteogenic differentiation and appeared to work by stimulating Smad-1/5/8 phosphorylation and activation. The ability of WISP-1 to enhance BMP-2 activity also was shown in vivo using an ectopic osteogenesis assay with BMSCs transduced with WISP-1, BMP-2, or both. When BMSCs were infected with lentivirus containing human WISP1 shRNA, they formed less bone in vivo and were less responsive to BMP-2, confirming that WISP-1 and BMP-2 have a functional interaction. Immunoprecipitation (IP) and Western blot analysis showed that WISP-1 bound directly to BMP-2 and showed that WISP-1 increased BMP-2 binding to hBMSCs in a dose-dependent fashion. To understand how WISP-1 enhanced BMP-2 signaling, the influence of WISP-1 on integrin expression was analyzed. WISP-1 induced the mRNA and protein levels of α(5)-integrin and, further, was found to bind to it. Antibody-blocking experiments showed that the BMP-2 binding to BMSCs that was enhanced by WISP-1 was completely neutralized by treatment with anti-integrin α(5)β(1) antibody. Pilot studies and the use of transgenic mice that overexpressed human WISP-1 in preosteoblasts had increased bone mineral density (BMD), trabecular thickness, and bone volume (BV/TV) over wild-type controls, supporting observations using human osteoprogenitors that WISP-1 has a positive influence on osteogenesis in vivo. In conclusion, these studies show, for the first time, that WISP-1 has a positive influence on bone cell differentiation and function and may work by enhancing the effects of BMP-2 to increase osteogenesis through a mechanism potentially involving binding to integrin α(5)β(1).


Figures

Fig. 1
Fig. 1
Relative expression of alkaline phosphatase and WISP-1 relative to alizarin red accumulation during the osteogenic differentiation of hBMSCs. Cells were cultured with osteogenic induction medium, and total RNA was collected at 0, 3, 7, 10, and 14 days, and the mRNA expression levels of ALP (A) and WISP1 (B) were evaluated by real-time PCR. The time points are the numbers of days after the cells reached confluence. The expression of each gene was normalized to that of its respective S29 ribosomal RNA. Data are reported as mean ± SE (n = 3). ***p < .001 versus day 0. (C) Alizarin red S staining in the cells whose ALP and WISP1 mRNA expression patterns are shown in panel A.
Fig. 2
Fig. 2
WISP-1 enhances the effects of BMP-2-induced osteoblastic differentiaion in vitro. Relative mRNA expression levels of ALP (A) and OPN (B) measured by real-time RT-PCR 7 days after the transduction with adWISP/adBMP-2. The expression of each gene was normalized relative to S29 ribosomal RNA. *p < .05; ***p < .001 versus adCMV-transduced sample; and ###p < .001 versus adBMP-2-transduced sample. (C) hBMSCs stained with alizarin red S to measure Ca2+ deposition after transduction with adWISP-1 and adBMP-2 separately or in combination when cultured in osteogenic induction medium for 2 weeks. (D) Quantitative evaluation of alizarin red S staining. Data are reported as mean ± SE (n = 3). *p < .05; ***p < .001 versus the sample transduced with adCMV; and #p < .05 versus the sample transduced with adBMP-2. AdWISP-1 alone had little effect on hBMSC osteogenic potential but did enhance the effect of adBMP-2 on ALP and OPN expression (A, B) and mineralization (C, D).
Fig. 3
Fig. 3
Effect of WISP-1 and BMP-2 on reporter activation and induced Smad-1/5/8 phosphorylation. (A) To test the BMP-sensitive Id1 promoter activation, C2C12 cells were transduced with adWISP-1 and adBMP-2 (1000 particles/cell) separately or in combination, and after 5 days, luciferase activity was measured. ***p < .001 versus the sample tranduced with adCMV and ###p < .001 versus the sample transduced with adBMP-2. (B) Smad-1/5/8 phosphorylation was measured in hBMSCs transduced with adWISP-1 and adBMP-2 (5000 particles/cell) separately or in combination. After 48 hour, total cell lysates were collected and resolved by gel electrophoresis and transferred to PVDF membrane and then were incubated with an antibody to either phosphorylated Smad-1/5/8 (p-Smad-1/5/8) or total Smad-1. HSP90 served as an internal control. The experiment was repeated three times, and relative levels of p-Smad/total Smad were plotted graphically in panel C. Data are reported as mean ± SE (n = 3). *p < .05; ***p < .001 versus the sample transduced with adCMV; and #p < .05 versus the sample transduced with adBMP-2.
Fig. 4
Fig. 4
Effects of WISP-1 and BMP-2 on osteogenesis in vivo. hBMSCs were transduced with control CMV adenovirus (adCMV), adWISP-1, adBMP-2, or both and then implanted under the skin of immunocompromised mice. Implants were harvested after 4 weeks and analyzed by histology. (A) Representative sections from implants, with black arrows pointing to regions of ectopic bone formation. (B) Quantitation of the area of bone formed in four random sections from implants shown in panel A. *p < .05; ***p < .001 versus sample transduced with adCMV; and ###p < .05 versus sample transduced with adBMP-2.
Fig. 5
Fig. 5
Effect of WISP1 knockdown on osteogenesis in vivo and in vitro. (A) hBMSCs were infected with lentivirus harboring control shRNA (GFP) or shWISP-1 and implanted ectopically to assess bone formation capacity in vivo when harvested at 6 weeks. Arrows point to sites of ectopic bone formed in the implant. (B) Quantitation of the area of new bone formed in control lentivirus (GFP) compared with shWISP-1 lentivirus–infected hBMSCs. ***p < .001 versus GFP-infected cells. Relative expression levels of WISP1 mRNA (C), ALP mRNA (D), and OPN mRNA (E) in hBMSCs infected with lentivirus containing shRNA to WISP1. ***p < .001 versus GFP. (F) Relative levels of p-Smad and total Smad-1/5/8 in hBMSCs infected with GFP lentivirus controls and shWISP-1 lentivirus either with or without treatment with recombinant human BMP-2 (rhBMP-2). (G) Relative expression of ALP mRNA in the same samples shown in panel F. **p < .01 versus GFP. WISP1 shRNA–infected cells showed diminished response to rhBMP compared with control cells.
Fig. 6
Fig. 6
Interaction between WISP-1 and BMP-2. (A, B) Solid-phase binding assay for WISP-1 and BMP-2. Tissue culture wells were precoated with different concentrations of either WISP-1 (A) or BMP-2 (B) (0.3, 1, and 3 µg/mL) and incubated with BMP-2 (A) or WISP-1 (B), respectively, at 37°C for 2 hours. Total binding of each protein was determined by measuring immunoreactivity toward the anti-BMP-2 antibody (A) or anti-WISP-1 antibody (B). Data are reported as mean ± SE (n = 4). *p < .05; ***p < .001 versus the sample treated with 0.3 µg/mL of protein. (C) Immunoprecipitation using BMP-2 antibody. hBMSCs were transduced with adWISP-1 and adBMP-2 separately or in combination, and after 3 days, cell lysates were collected. Immunoprecipitation was performed using an anti-BMP-2 antibody, and the amount of WISP-1 “pulled down” was measured using an anti-WISP-1 antibody. (D) The affinity of BMP-2 for binding to hBMSCs transduced with adWISP-1. hBMSCs were transduced with adWISP-1 in hBMSCs, and 3 days later, the cells were fixed and incubated with BMP-2 for 2 hours. The amount of BMP-2 bound to the cells was evaluated by measuring the amount of immunoreactivity using an anti-BMP-2 antibody. The relative amount of BMP-2 present was normalized to the levels of β-actin. Data are reported as mean ± SE (n = 4). **p < .01; ***p < .001 versus the nontransduced sample. (E) Levels of cell surface associated WISP-1 in hBMSCs transduced with adWISP-1, and after 3 days, the amount of WISP-1 was normalized to β-actin. Data are reported as mean ± SE (n = 4). ***p < .001 versus the nontransduced sample.
Fig. 7
Fig. 7
Effect of WISP-1 on the production of α5 . (A–D) Relative expression levels of α5, αV, β3, and β1 mRNA in hBMSCs transduced with adWISP-1 or adWISP-1 for 3 days, as determined by real-time PCR. The expression of each gene was normalized to the level of S29 ribosomal RNA. ***p < .001 versus the sample transduced with adCMV. (E) Representative Western blot analysis of α5 protein in hBMSCs transduced with adWISP-1 for 3 days.
Fig. 8
Fig. 8
Interaction of WISP-1 with α5 β1 . (A, B) Solid-phase binding of WISP-1– integrin α5 β1 interactions. Tissue culture plates were coated with different concentrations of WISP-1 (A) or integrin α5 β1 (B) (0.3, 1, and 3 µg/mL) and were incubated with integrin α5 β1 (A) or WISP-1 (B), respectively, at 37°C for 2 hours. The amount of binding of each protein was determined by measuring immunoreactivity toward the anti-integrin α5 β1 antibody (A) or anti-WISP-1 antibody (B). Data are reported as mean ± SE (n = 4). *p < .05 versus the sample treated with 0.3 µg/mL of protein. (C) Western blotting showing that WISP-1 binds to integrin α5 β1 using immunoprecipitation with anti-integrin α5 β1 antibody. hBMSCs were transduced with adWISP-1 (5000 particles/cell), and 3 days later, the cell lysates were collected. Then immunoprecipitation and Western blotting were performed with anti-integrin α5 β1 antibody and anti-WISP-1 antibody, respectively. (D) Inhibition assay using anti-integrin α5 β1 antibody. hBMSCs, were preincubated with or without anti-integrin α5 β1 antibody (10 µg/mL) or IgG antibody (10 µg/mL) for 1 hour, and then cells were transduced with adWISP-1 (5000 particles/cell). Three days after transduction, the cells were fixed and incubated with BMP-2 for 2 hours. BMP-2+ cells were detected by measuring immunoreactivity toward the anti-BMP-2 antibody. The graph shows the quantitation of these data normalized to β-actin. Data are reported as mean ± SE (n = 4). *p < .05; ***p < .001 versus nontreatment in the sample transduced with adCMV; ###p < .001 versus treatment with anti-integrin α5 β1 antibody in the sample transduced with adWISP-1.
Fig. 9
Fig. 9
The expression of hWISP-1 in transgenic mice designed to express hWISP-1 in bone. (A) A 1.3-kb DNA fragment coding for human WISP-1 was cloned downstream of a 2.4-Kb DNA containing the Col1A1 bone-specific promoter (2.3-kb promoter plus 0.1-kb exon 1) and was used to make transgenic mice. (B) mBMSCs were collected from WISP1-Tg and wild-type mice and cultured with osteogenic induction medium for up to 4 weeks after confluence. The relative expression levels of human WISP1 mRNA were determined in mBMSCs derived from wild-type (left) or WISP1-Tg (right) mice. In order to detect human WISP1 and mouse WISP1, RT-PCR was performed using human WISP-1 or mouse-specific primers, respectively (Table 1). RT-PCR of mRNA encoding Gapdh served as an internal control. (C) To analyze the relative levels of WISP-1 protein, a Western blot was performed using anti-WISP-1 antibody (upper panel), where HSP90 served as an internal control (lower panel). The antibody, LF-187, crossreacted with mouse WISP-1 but showed higher total levels of WISP-1 (human plus mouse) in the WISP1-Tg cells as they became more osteogenic.
Fig. 10
Fig. 10
Bone phenotype of the WISP1-Tg mice. (A) X-ray images of the femurs from 8-week-old WISP1-Tg and wild-type mice revealing increased density of bone, depicted by increased X-ray intensity. (B) µCT images of of wild-type and WISP1-Tg mice, confirming increased bone density, as shown graphically by 2D images of sagittal sections of femurs from 8-week-old wild-type and WISP1-Tg mice. (C) 3D rendering of the trabecular bone shown. (D) Trabecular bone mineral density (BMD), (E) trabecular bone volume per tissue volume (BV/TV), (F) bone surface per bone volume (BS/BV), (G) trabecular thickness (Tb.Th), (H) trabecular number (Tb.N), and (I) trabecular spacing (Tb.S), (J) cross-sectional area (CSA, mm2), (K) cortical area (CA, mm2), (L) medullary area (MA, mm2), (M) cortical thickness (mm). All measurements were obtained either from an elliptical cylinder within the metaphases or by imaging a cross-sectional area in the midshaft region of the femur. Data are reported as mean ± SE (n = 6). *p < .05; **p < .01 versus wild-type sample.

Similar articles

Cited by

References

    1. Parisi MS, Gazzerro E, Rydziel S, Canalis E. Expression and regulation of CCN genes in murine osteoblasts. Bone. 2006;38:671–677. - PubMed
    1. French DM, Kaul RJ, D'Souza AL, et al. WISP-1 is an osteoblastic regulator expressed during skeletal development and fracture repair. Am J Pathol. 2004;165:855–867. - PMC - PubMed
    1. Xu L, Corcoran RB, Welsh JW, Pennica D, Levine AJ. WISP1 is a Wnt-1- and β-catenin-responsive oncogene. Genes Dev. 2000;14:585–595. - PMC - PubMed
    1. Hoeppner LH, Secreto FJ, Westendorf JJ. Wnt signaling as a therapeutic target for bone diseases. Expert Opin Ther Targets. 2009;13:485–496. - PMC - PubMed
    1. Ling L, Nurcombe V, Cool SM. Wnt signaling controls the fate of mesenchymal stem cells. Gene. 2009;433:1–7. - PubMed

Publication types

MeSH terms