

Liquid chromatography-mass spectrometry-based parallel metabolic profiling of human and mouse model serum reveals putative biomarkers associated with the progression of nonalcoholic fatty liver disease
- PMID: 20684516
- PMCID: PMC2933275
- DOI: 10.1021/pr1002593
Liquid chromatography-mass spectrometry-based parallel metabolic profiling of human and mouse model serum reveals putative biomarkers associated with the progression of nonalcoholic fatty liver disease
Abstract
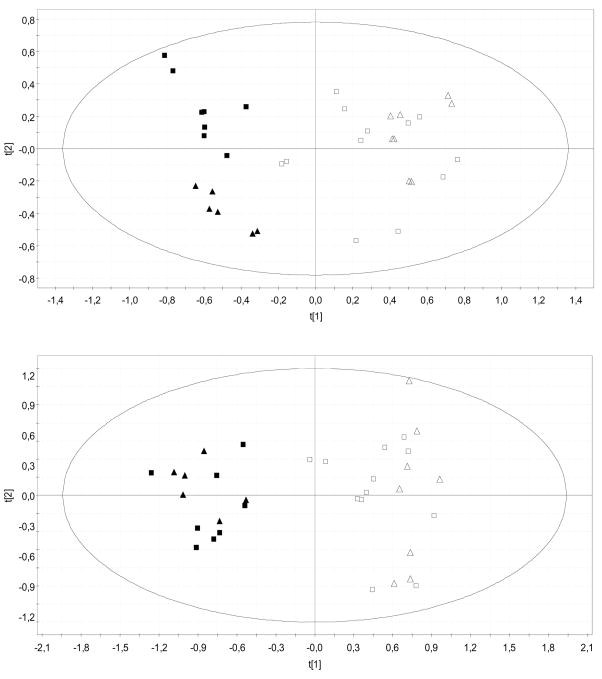
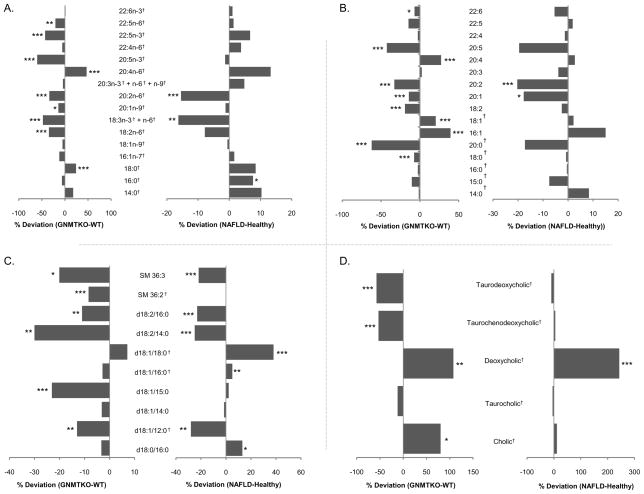
Nonalcoholic fatty liver disease (NAFLD) is the most common form of chronic liver disease in most western countries. Current NAFLD diagnosis methods (e.g., liver biopsy analysis or imaging techniques) are poorly suited as tests for such a prevalent condition, from both a clinical and financial point of view. The present work aims to demonstrate the potential utility of serum metabolic profiling in defining phenotypic biomarkers that could be useful in NAFLD management. A parallel animal model/human NAFLD exploratory metabolomics approach was employed, using ultra performance liquid chromatography-mass spectrometry (UPLC-MS) to analyze 42 serum samples collected from nondiabetic, morbidly obese, biopsy-proven NAFLD patients, and 17 animals belonging to the glycine N-methyltransferase knockout (GNMT-KO) NAFLD mouse model. Multivariate statistical analysis of the data revealed a series of common biomarkers that were significantly altered in the NAFLD (GNMT-KO) subjects in comparison to their normal liver counterparts (WT). Many of the compounds observed could be associated with biochemical perturbations associated with liver dysfunction (e.g., reduced Creatine) and inflammation (e.g., eicosanoid signaling). This differential metabolic phenotyping approach may have a future role as a supplement for clinical decision making in NAFLD and in the adaption to more individualized treatment protocols.
Figures

Similar articles
-
Mass-Spectrometry-Based Serum Metabolomics of a C57BL/6J Mouse Model of High-Fat-Diet-Induced Non-alcoholic Fatty Liver Disease Development.J Agric Food Chem. 2015 Sep 9;63(35):7873-84. doi: 10.1021/acs.jafc.5b02830. Epub 2015 Aug 27. J Agric Food Chem. 2015. PMID: 26262841
-
Metabolic analysis of early nonalcoholic fatty liver disease in humans using liquid chromatography-mass spectrometry.J Transl Med. 2021 Apr 15;19(1):152. doi: 10.1186/s12967-021-02820-7. J Transl Med. 2021. PMID: 33858428 Free PMC article.
-
Mapping of the circulating metabolome reveals α-ketoglutarate as a predictor of morbid obesity-associated non-alcoholic fatty liver disease.Int J Obes (Lond). 2015 Feb;39(2):279-87. doi: 10.1038/ijo.2014.53. Epub 2014 Mar 28. Int J Obes (Lond). 2015. PMID: 24675715
-
A metabolomics approach to the validation of predictive metabolites and phenotypic expression in non-alcoholic fatty liver disease.Life Sci. 2023 Jun 1;322:121626. doi: 10.1016/j.lfs.2023.121626. Epub 2023 Mar 31. Life Sci. 2023. PMID: 37003543
-
Non-invasive Scores and Serum Biomarkers for Fatty Liver in the Era of Metabolic Dysfunction-associated Steatotic Liver Disease (MASLD): A Comprehensive Review From NAFLD to MAFLD and MASLD.Curr Obes Rep. 2024 Sep;13(3):510-531. doi: 10.1007/s13679-024-00574-z. Epub 2024 May 29. Curr Obes Rep. 2024. PMID: 38809396 Free PMC article. Review.
Cited by
-
Systems biology for hepatologists.Hepatology. 2014 Aug;60(2):736-43. doi: 10.1002/hep.27023. Epub 2014 Jun 18. Hepatology. 2014. PMID: 24449428 Free PMC article. Review.
-
Analysis of Therapeutic Effect of Ilex hainanensis Merr. Extract on Nonalcoholic Fatty Liver Disease through Urine Metabolite Profiling by Ultraperformance Liquid Chromatography/Quadrupole Time of Flight Mass Spectrometry.Evid Based Complement Alternat Med. 2013;2013:451975. doi: 10.1155/2013/451975. Epub 2013 Aug 27. Evid Based Complement Alternat Med. 2013. PMID: 24066013 Free PMC article.
-
Metabolomic similarities between bronchoalveolar lavage fluid and plasma in humans and mice.Sci Rep. 2017 Jul 11;7(1):5108. doi: 10.1038/s41598-017-05374-1. Sci Rep. 2017. PMID: 28698669 Free PMC article.
-
Serum metabolites in non-alcoholic fatty-liver disease development or reversion; a targeted metabolomic approach within the PREDIMED trial.Nutr Metab (Lond). 2017 Sep 2;14:58. doi: 10.1186/s12986-017-0213-3. eCollection 2017. Nutr Metab (Lond). 2017. PMID: 28878811 Free PMC article.
-
Metabolomic profiles of hepatocellular carcinoma in a European prospective cohort.BMC Med. 2015 Sep 23;13:242. doi: 10.1186/s12916-015-0462-9. BMC Med. 2015. PMID: 26399231 Free PMC article.
References
-
- World Health Organization. Obesity and Overweight. Geneva: 2006. Factsheet No. 3011.
-
- Reid AE. Nonalcoholic steatohepatitis. Gastroenterology. 2001;121(3):710–23. - PubMed
-
- Clark JM, Diehl AM. Defining nonalcoholic fatty liver disease: implications for epidemiologic studies. Gastroenterology. 2003;124(1):248–50. - PubMed
-
- Marchesini G, Bugianesi E, Forlani G, Cerrelli F, Lenzi M, Manini R, Natale S, Vanni E, Villanova N, Melchionda N, Rizzetto M. Nonalcoholic fatty liver, steatohepatitis, and the metabolic syndrome. Hepatology. 2003;37(4):917–23. - PubMed
-
- Adams LA, Lindor KD. Nonalcoholic fatty liver disease. Ann Epidemiol. 2007;17(11):863–9. - PubMed
Publication types
MeSH terms
Substances
Grants and funding
LinkOut - more resources
Full Text Sources
Other Literature Sources
Research Materials
