. 2010 Aug 31;49(34):7303-13.
doi: 10.1021/bi101001v.

Ca(2+) sensor GCAP1: A constitutive element of the ONE-GC-modulated odorant signal transduction pathway

Affiliations

Ca(2+) sensor GCAP1: A constitutive element of the ONE-GC-modulated odorant signal transduction pathway

Alexandre Pertzev et al. Biochemistry. .

Abstract

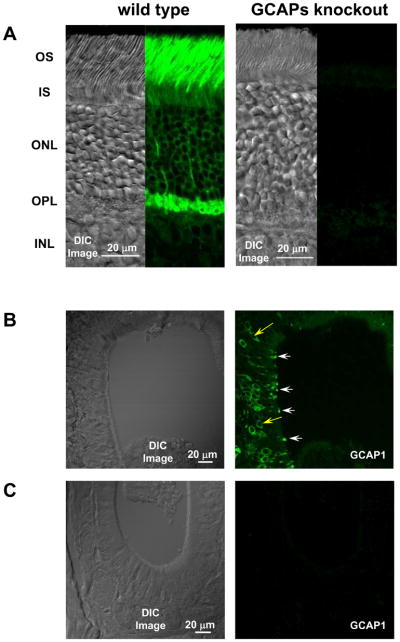
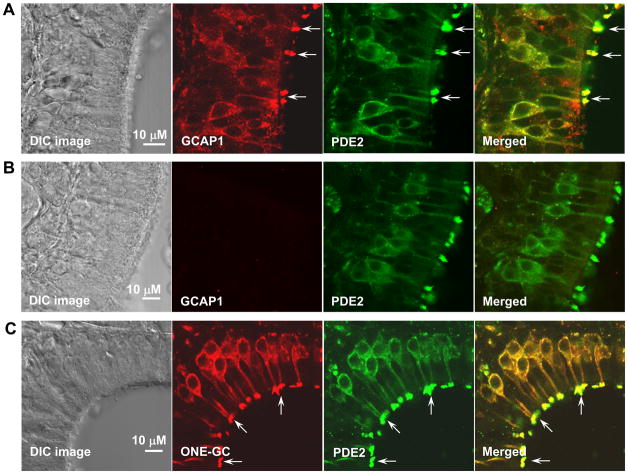
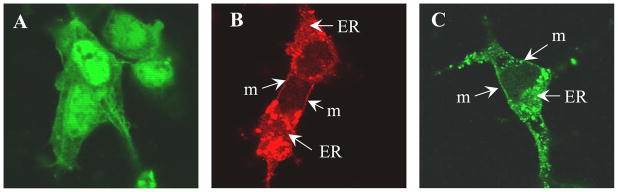
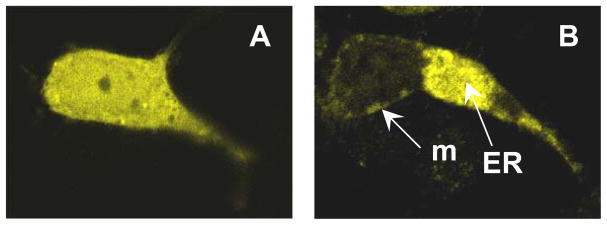
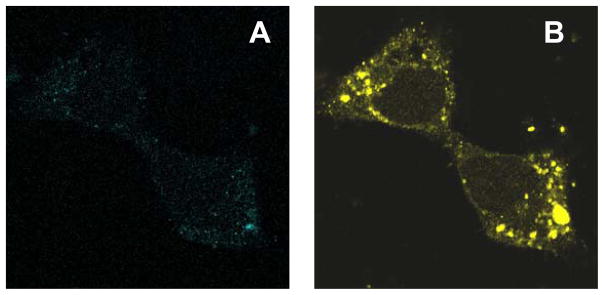
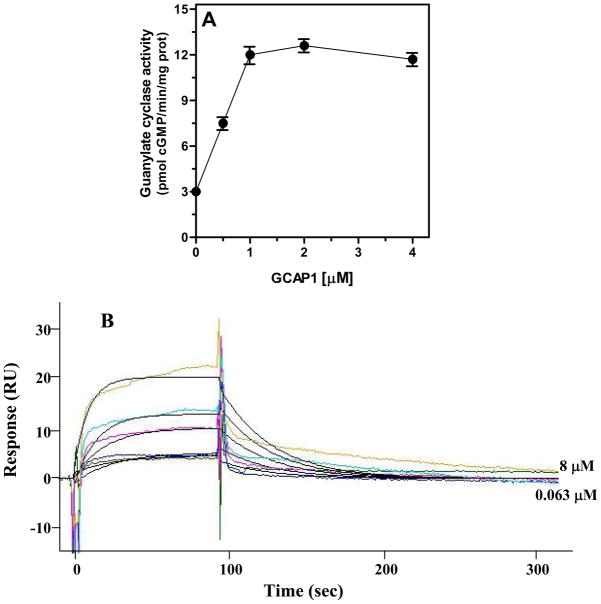
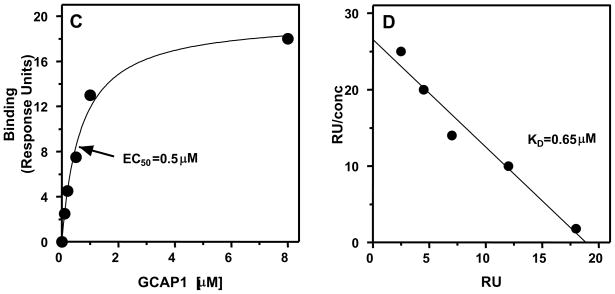
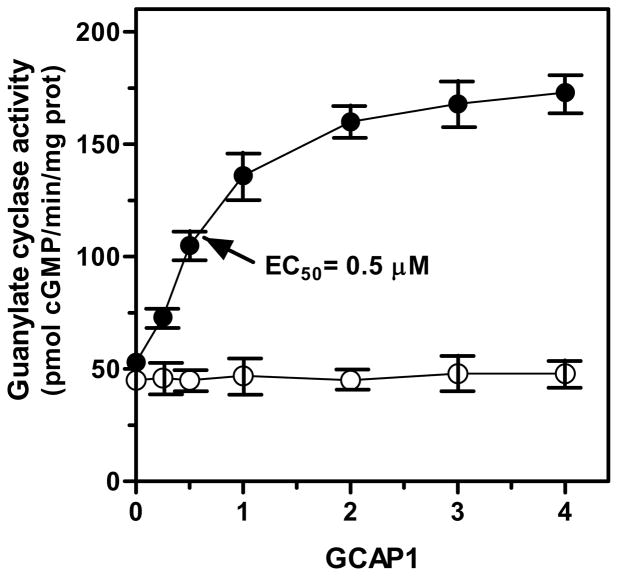
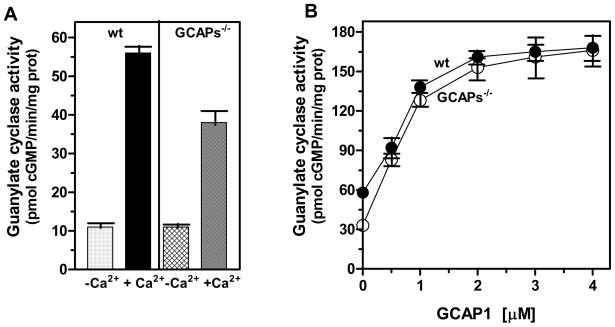
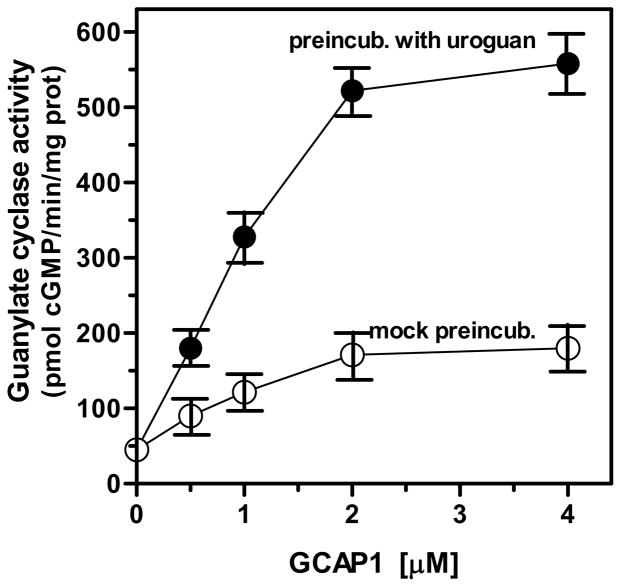
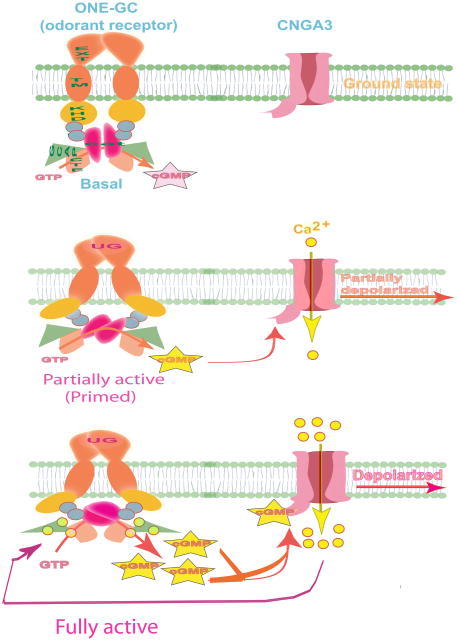
In a small subset of the olfactory sensory neurons, the odorant receptor ONE-GC guanylate cyclase is a central transduction component of the cyclic GMP signaling pathway. In a two-step transduction model, the odorant, uroguanylin, binds to the extracellular domain and activates its intracellular domain to generate the odorant second messenger, cyclic GMP. This study via comprehensive technology, including gene deletion, live cell Forster resonance energy transfer (FRET), and surface plasmon resonance (SPR) spectroscopy, documents the identity of a remarkably intriguing operation of a Ca(2+) sensor component of the ONE-GC transduction machinery, GCAP1. In the ciliary membranes, the sites of odorant transduction, GCAP1 is biochemically and physiologically coupled to ONE-GC. Strikingly, this coupling reverses its well- established function in ROS-GC1 signaling, linked with phototransduction. In response to the free Ca(2+) range from nanomolar to semimicromolar, it inhibits ROS-GC1, yet in this range, it incrementally stimulates ONE-GC. These two opposite modes of signaling two SENSORY processes by a single Ca(2+) sensor define a new transduction paradigm of membrane guanylate cyclases. This paradigm is pictorially presented.


Figures

Figure 1
Figure 1. Immunoreactivity of GCAP1 in the mouse retina and olfactory neuroepithelium
(A) The affinity purified antibody was used to immunostain retinal cryosections from the wild type (“wild type”) and GCAP1−/−GCAP2−/− (“GCAPs knockout”) mice. For each type of mice the left panel presents the differential interference contrast (DIC) image of the section showing the retinal layers (indicated to the left); the right panels show staining with GCAP1 antibody. In the retina from the wild type mouse the staining is strong in rod and cone outer segments and in the OPL. In the retina from the GCAPs knockout mouse there is no staining in either retinal layer. The same antibody was used to immunostain cryosections of the olfactory neuroepithelium from the wild type (B) and GCAPs knockout (C) mice. In both (B) and (C) the left panels show the DIC images and the right panels, immunostaining with GCAP1 antibody. In the olfactory neuroepithelial section from the wild type mouse (B) selected olfactory neurons show intense staining with GCAP1 antibody. The staining is intense in the cilia (four indicated by white arrows) and less intense in the dendrites and somas (two indicated by yellow arrows). The staining is absent in the GCAPs knockout mouse (C).
Figure 2
Figure 2. GCAP1 is expressed in the same as ONE-GC and PDE2A olfactory neurons
Cryosections of the olfactory neuroepithelium from the wild type and GCAPs knockout mice were immuno-stained with GCAP1 and PDE2A antibodies or ONE-GC and PDE2A antibodies as described in “Experimental Procedures”. The DIC image showing the integrity of the olfactory neuroepithelium sections are presented at the left (“DIC image”). (A) Cryosection of the wild type mouse olfactory neuroepithelium was immunostained with GCAP1 and PDE2A antibodies. Intense staining with either antibody was observed in the cilia (3 intense signals are indicated with arrows) and of lower intensity in the dendrites and somas. (B) Cryosection of the GCAPs knockout mouse olfactory neuroepithelium was immunostained with GCAP1 and PDE2A antibodies. There was no immunoreactivity with the GCAP1 antibody whereas intense labeling of selected neurons with anti PDE2A antibody was observed. (C) Cryosection of the wild type mouse olfactory neuroepithelium was immunostained with ONE-GC and PDE2A antibodies. Strong signals with both antibodies were observed in the cilia (3 out of several signals are indicated with arrows). The dendrites and somas of the immunoreactive neurons were stained as well. The right-hand panels (“Merged”) present the composite images of GCAP1 and PDE2 or ONE-GC and PDE2 staining and show that both GCAP1 and ONE-GC are co-expressed with PDE2A
Figure 3
Figure 3. Cellular localization of GCAP1 and ONE-GC expressed in COS cells
(A) GCAP1 expressed in COS cells. (B) ONE-GC expressed in COS cells. (C) GCAP1 co-expressed with ONE-GC in COS cells. COS-cells were transfected with GCAP1 or/and ONE-GC cDNA. 72 hr after transfection the cells were fixed with 4% paraformaldehyde and incubated with GCAP1 or ONE-GC antibody followed by incubation with secondary antibodies conjugated with DyLight 488 (green) for GCAP1 immunolocalization and with DyLight 549 (red) for ONE-GC imunolocalization. The DyLight 488 was excited at 488 nm and DyLight 549, at 543 nm. The cells were viewed using an inverted Olympus IX81 microscope/FV1000 Spectral laser confocal system. Indicated by arrows are: cell membrane (m) and membranes of endoplasmic reticulum (ER).
Figure 4
Figure 4. Co-localization of GCAP1-YFP with ONE-GC-CFP in live COS cells
(A) GCAP1-YFP was expressed in COS cells. Laser excitation was at 515 nm. GCAP1-YFP fusion protein is present in the entire cell. (B) GCAP1-YFP was co-expressed with ONE-GC in COS cells. Laser excitation was at 515 nm. In the presence of ONE-GC fusion protein GCAP1-YFP localizes to cellular membranes, plasma and ER membranes, the site of ONE-GC expression.
Figure 5
Figure 5. Co-expression of GCAP1-YFP with ONE-GC-CFP quenches CFP fluorescence
GCAP1-YFP and ONE-GC-CFP were co-expressed in COS cells. 72 hr after transfection the cells were observed under confocal microscope. Laser excitation was at 458 nm and the emission was observed at 480 nm (CFP) and at the 530 nm (CFP).
Figure 6
Figure 6. Binding of GCAP1 to the ONE-GC fragment aa 836-1110. SPR analysis
(A) ONE-GC fragment consisting aa residues 836-1110 was expressed in bacterial cells as a soluble protein as described in “Experimental Procedures” section and analyzed for GCAP1-dependent activity. Experiment was done in triplicate and repeated two times with separate preparations of the ONE-GC fragment. The results presented are mean ± SD from these experiments. (B) The ONE-GC fragment aa 836-1110 was immobilized on a CM5 sensor chip and GCAP1 was supplied in the mobile phase at concentrations between 0.063 and 8 μM in the running buffer. Typical set of overlaid sensorgrams together with fitting curves is shown. The curves presented were obtained after subtracting the effect of buffers and salts on resonance signals using the uncoated (blank) surface in flow cell 1 as the reference surface using BIAevaluation software. (C) Binding (RU) as a function of the concentration of GCAP1. (D) Scatchard transformation of the binding data. Experiment was repeated five times with different GCAP1 preparations. The results presented are from one typical experiment.
Figure 7
Figure 7. Ca2+-dependent activation of ONE-GC by GCAP1
Olfactory neuroepithelium was isolated from wild type mice, homogenized in 250 mM sucrose/10 mMTris-HCl pH 7.5 buffer and the particulate fraction was isolated. This was analyzed for basal and GCAP1-dependent guanylate cyclase activity in the presence of 10 μM Ca2+ (closed circles) or 1 mM EGTA (open circles). The experiment was done in triplicate and repeated three times for the wild type mouse and two times for the knockout mouse. The results presented are the average ± SD from these experiments.
Figure 8
Figure 8. GCAP1-modulated ONE-GC system in the olfactory neuroepithelium
(A) Particulate fractions of the olfactory neuroepithelium were isolated from the wild type (wt) and GCAPs knockout (GCAPs−/−) mice. Membranes were assayed for the guanylate cyclase activity in the presence of 1 mM EGTA (−Ca2+) or 10 μM Ca2+ (+Ca2+). (B) The membranes were assayed for guanylate cyclase activity in the presence of 10 μM Ca2+ and indicated concentrations of GCAP1. Cyclic GMP formed was measured by radioimmunoassay. The experiment was done in triplicate and repeated two times with separate membrane preparations. The results presented (mean ± SE) are from one experiment.
Figure 9
Figure 9. Synergetic effect of uroguanylin and GCAP1 on ONE-GC activity
Olfactory neuroepithelium from the wild type mouse was homogenized in the absence of Ca2+, pre-incubated with 10−6 M uroguanylin, the membrane fraction was prepared, and assayed for guanylate cyclase activity in the presence of 10 μM Ca2+ and increasing concentrations of GCAP1. Membranes from mock-pre-incubated homogenates were treated as controls. The experiment was done in triplicate and repeated three times with separate homogenates. The results are mean ± SD from these experiments.
Figure 10
Figure 10. Two-step uroguanylin - GCAP1 - ONE-GC signal transduction model in the olfactory receptor neuron
The Model. Basal: Ground state. The concentration of free [Ca2+]i in the resting cilia is 60–100 nM; ONE-GC dimer is bound to GCAP1 and its activity is in the Basal state. Primed, partially active state: The odorant, uroguanylin, signaling begins by its binding to the extracellular receptor domain of ONE-GC. In a Ca2+-independent fashion, it causes structural changes in the domain, which are transduced to the intracellular domain and finally to the catalytic module, causing its partial activation, of ~3-fold. The small amount of cyclic GMP produced as a result of this activation opens a fraction of the CNG3 channels and some influx of Ca2+, which partially depolarizes the ONE-GC neuron’s membrane. Fully active state: The Ca2+ ions which entered the ONE-GC neuron as a result of the partial ONE-GC activation bind to GCAP1 and create two physiological consequences: (1) cause full activation of ONE-GC; and (2) the resulting cyclic GMP opens maximal number of CNGA3 channels causing maximal influx of Ca2+ and depolarization of the ONE-GC neuron’s membrane.

Similar articles

Cited by

References

    1. Munger SD, Leinders-Zufall T, Zufall F. Subsystem Organization of the mammalian sense of smell. Ann Rev Physiol. 2009;71:115–140T. - PubMed
    1. Nakamura T. Cellular and molecular constituents of olfactory sensation in vertebrates. Comp Biochem Physiol A Mol Integr Physiol. 2000;126:17–32. - PubMed
    1. Menini A. Calcium signaling and regulation in olfactory neurons. Curr Opin Neurobiol. 1999;9:419–426. - PubMed
    1. Schild D, Restrepo D. Transduction mechanisms in vertebrate olfactory receptor cells. Physiol Rev. 1998;78:429–466. - PubMed
    1. Belluscio L, Gold GH, Nemes A, Axel R. Mice deficient in G(olf) are anosmic. Neuron. 1998;20:69–81. - PubMed

Publication types