. 2010 Aug 12;114(31):10039-48.
doi: 10.1021/jp1057308.

RNA structure determination using SAXS data

Affiliations

RNA structure determination using SAXS data

Sichun Yang et al. J Phys Chem B. .

Abstract

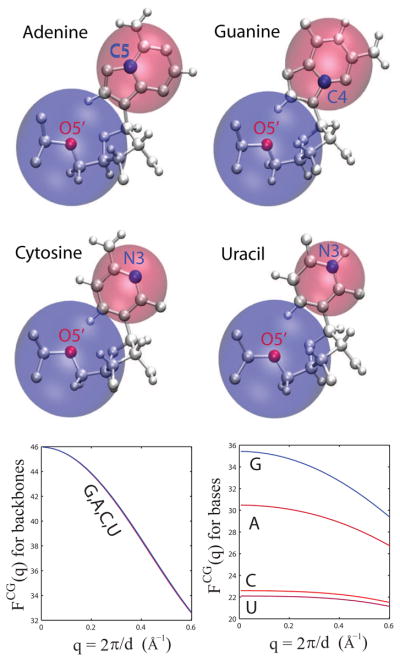
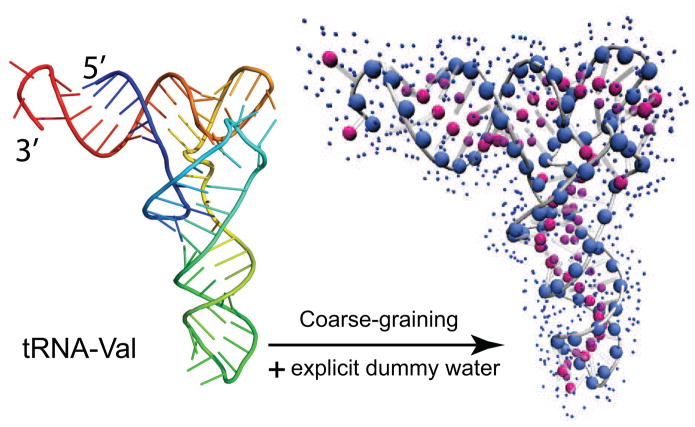
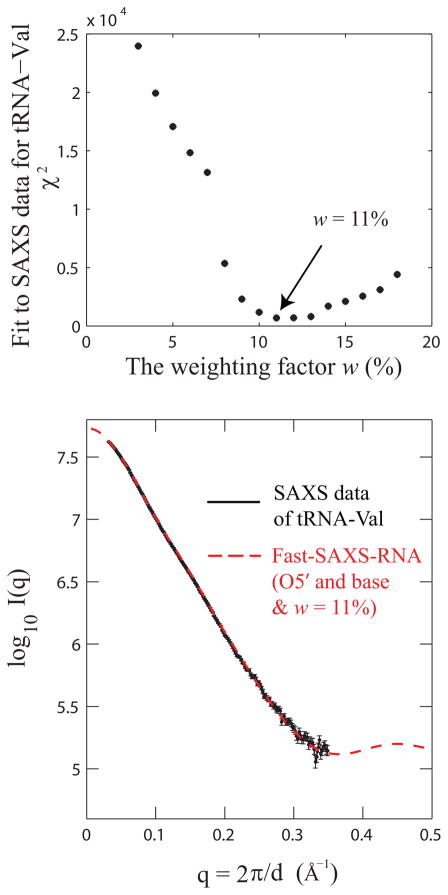
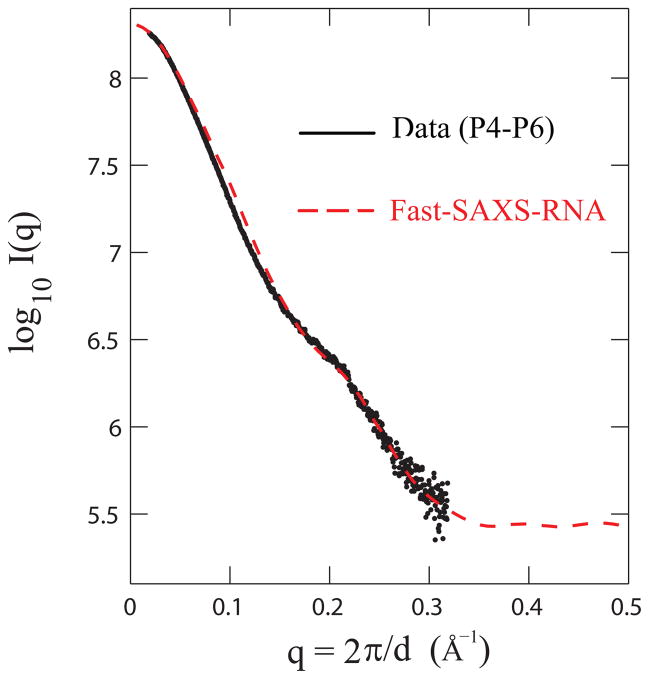
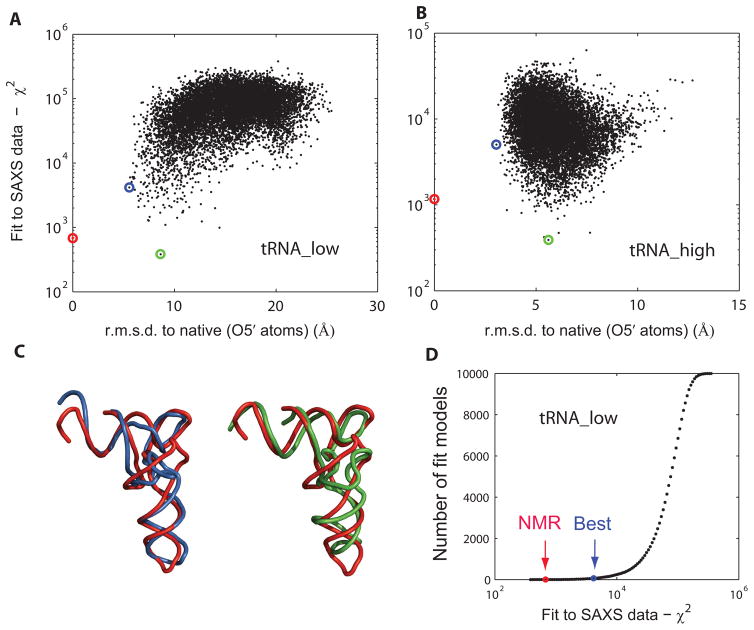
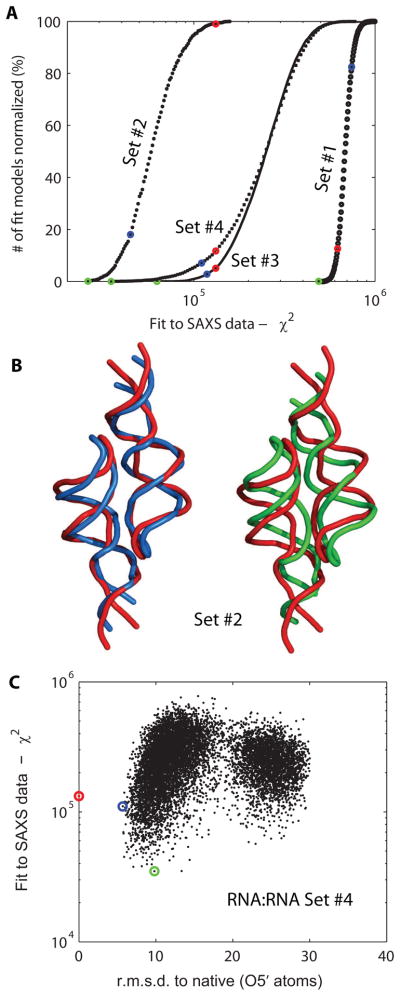
Exploiting the experimental information from small-angle X-ray solution scattering (SAXS) in conjunction with structure prediction algorithms can be advantageous in the case of ribonucleic acids (RNA), where global restraints on the 3D fold are often lacking. Traditional usage of SAXS data often starts by attempting to reconstruct the molecular shape ab initio, which is subsequently used to assess the quality of a model. Here, an alternative strategy is explored whereby the models from a very large decoy set are directly sorted according to their fit to the SAXS data. For rapid computation of SAXS patterns, the method developed here makes use of a coarse-grained representation of RNA. It also accounts for the explicit treatment of the contribution to the scattering of water molecules and ions surrounding the RNA. The method, called Fast-SAXS-RNA, is first calibrated using a tRNA (tRNA-val) and then tested on the P4-P6 fragment of group I intron (P4-P6). Fast-SAXS-RNA is then used as a filter for decoy models generated by the MC-Fold and MC-Sym pipeline, a suite of RNA 3D all-atom structure algorithms that encode and exploit RNA 3D architectural principles. The ability of Fast-SAXS-RNA to discriminate native folds is tested against three widely used RNA molecules in molecular modeling benchmarks: the tRNA, the P4-P6, and a synthetic hairpin suspected to assemble into a homodimer. For each molecule, a large pool of decoys are generated, scored, and ranked using Fast-SAXS-RNA. The method is able to identify low-rmsd models among top ranking structures, for both tRNA and P4-P6. For the hairpin, the approach correctly identifies the dimeric state as the solution structure over the monomeric state and alternative secondary structures. The method offers a powerful strategy for recognizing native RNA conformations as well as multimeric assemblies and alternative secondary structures, thus enabling high-throughput RNA structure determination using SAXS data.


Figures

Figure 1
Figure 1
Two-particle model of RNA for SAXS computing. (top) Schematic representation of the four RNA nucleic units: Adenine (A), Guanine (G), Cytosine (C) and Uracil (U). Each nucleotide is simplified into a two-particle model, where one particle accounts for the scattering of the phosphate and sugar groups, the backbone group, and the other for the sidechain group. The location of the site is determined by the position of the atom closest to the center-of-scattering. Backbone positions are highlighted by red dots, and sidechain ones in blue. The relative sizes of these particles are drawn approximately proportional to their scattering intensity at q = 0. (bottom) Derived structure factors. On the left are shown the structure factors for the backbone groups and on the right are the structure factors for the sidechain groups.
Figure 2
Figure 2
Coarse-graining for RNA scattering. (left) Cartoon representation of the 3D structure of valine transfer RNA (tRNA; PDB entry 2K4C), colored from blue at the 5′ end to red at the 3′ end. (right) The 3D structure is coarse-grained into the two-particle representation, where the backbone particles are large blue spheres, and the sidechain in red. In addition, explicit water molecules are placed surrounding the RNA molecule and shown as small blue dots.
Figure 3
Figure 3
Hydration layer contribution for RNA scattering. The contribution of the hydration layer is calibrated using the experimental SAXS data and the solution structure for a transfer RNA (tRNA; PDB entry 2K4C). (top) Fit of the solution structure to the SAXS data as a function of the weighting factor w. A value of w = 11% is optimal to fit the SAXS data. (bottom) Comparison of the experimental (black) and computed (red) SAXS profiles.
Figure 4
Figure 4
Model validation of the Fast-SAXS-RNA method. The two-particle model with the hydration layer is validated using the experimental SAXS data and the crystal structure for the P4-P6 fragment of group I intron (P4-P6; PDB entry 1GID). Comparison of the experimental (black) and Fast-SAXS-RNA computed (red) SAXS profiles. The χ2 difference (Eq. (10)) between these two curves is 1.8 × 10⁻³.
Figure 5
Figure 5
Application to tRNA. Two decoy sets are used: tRNA_low and tRNA_high. Each set contains 10,000 models (including the solution structure) covering different regimes of the conformational space. Plot of fit to the SAXS data χ2 as a function of RMSD to the solution structure (PDB entry 2K4C), for tRNA_low (A) and tRNA_high (B), respectively. Lower χ2 values indicate a better fit. RMSD is computed over all O5′ atoms. The solution structure is indicated in red, the lowest-RMSD model in blue and the best SAXS-fit model in green. (C) Representative tRNA_low decoy set models. Optimal superposition of the best lowest-RMSD model (blue; 5.6 Å) and the best SAXS-fit model (green; 8.6 Å) on the solution structure (red). (D) Cumulative model plot as a function of the fit to SAXS data χ2. Indicated are the positions of the solution structure (NMR) and the best lowest-RMSD model (Best). There are 61 models (out of ten thousand) which display better χ2 values than the best lowest-RMSD model. The q-ranges from qmin = 0.05 Å−1 to qmax = 0.32 Å−1 were used for tRNA χ2-score calculations.
Figure 6
Figure 6
Application to P4-P6. Two decoy sets are used: P4-P6_low and P4-P6_high. Each set contains approximatively 10,000 and 9,000 models (including the crystal structure). Plot of fit to the SAXS data χ2 of P4-P6 as a function of RMSD to its crystal structure (PDB entry 1GID), for P4-P6_low (A) and P4-P6_high (B), respectively. The crystal structure is indicated in red, the lowest-RMSD model in blue and the best SAXS-fit in green. (C) Representative P4-P6_low decoy set models. Optimal superposition of the best lowest-RMSD model (blue; 13.3 Å) and the best SAXS fit model (green; 16.0 Å) on the crystal structure (red). (D) Cumulative model plot as a function of the fit to the SAXS data (χ2). Indicated are the positions of the Crystal structure (Xtal) and the best lowest-RMSD model (Best). There are 40 models which display better χ2 values than the best RMSD model. The q-ranges from qmin = 0.02 Å−1 to qmax = 0.32 Å−1 were used for P4-P6 χ2-score calculations.
Figure 7
Figure 7
Application to an RNA dimer. (A) Cumulative model plot as a function of the fit to SAXS data χ2. A total of four decoy sets, from #1 to #4, are compared. These decoy sets address various multimerization states and secondary structures (see Methods). Since the number of models in each decoy set is different, the cumulative plot has been normalized to the fraction of total number of decoys in the set. For each set, the solution structure is highlighted in red (PDB entry 2JYH), the best lowest-RMSD model in blue, and the best SAXS-fit in green. For decoy set #1, the solution structure is considered to be the monomer unit. (B) Representative models from decoy set #2. The best SAXS-fit model (green; 7.5 Å) and best RMSD model (blue; 4.7 Å) optimally superimposed on the solution structure (red). (C) Plot of fit of SAXS data χ2 against RMSD, for models in decoy set #4. The solution structure is highlighted in red, and blue for the best RMSD model and green for the best SAXS-fit model.

References

    1. Putnam CD, Hammel M, Hura GL, Tainer JA. Quart Rev Biophys. 2007;40:191–285. - PubMed
    1. Doniach S. Chem Rev. 2001;101:1763–1778. - PubMed
    1. Koch MHJ, Vachette P, Svergun DI. Quart Rev Biophys. 2003;36:147–227. - PubMed
    1. Hura GL, Menon AL, Hammel M, Rambo RP, Poole FL, Tsutakawa SE, Jr, FEJ, Classen S, Frankel KA, Hopkins RC, jae Yang S, Scott JW, Dillard BD, Adams MWW, Tainer JA. Nat Meth. 2009;6:606–612. - PMC - PubMed
    1. Tsuruta H, Irving T. Curr Opin Struct Biol. 2008;18:601–608. - PMC - PubMed

Publication types