

Cerebral hemodynamic effects of acute hyperoxia and hyperventilation after severe traumatic brain injury
- PMID: 20684672
- PMCID: PMC2953927
- DOI: 10.1089/neu.2010.1339
Cerebral hemodynamic effects of acute hyperoxia and hyperventilation after severe traumatic brain injury
Abstract
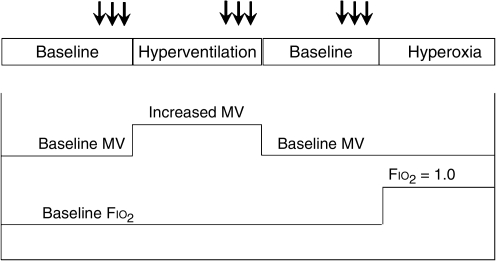
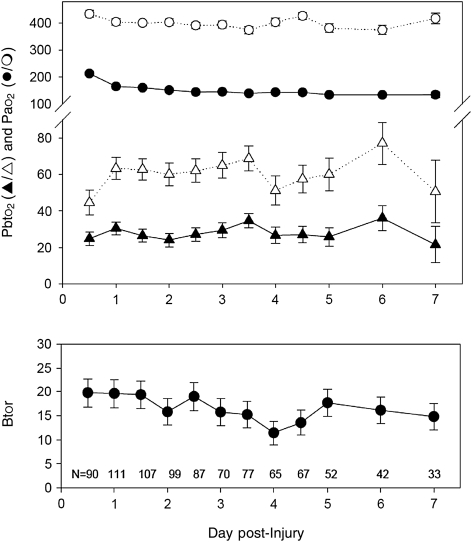
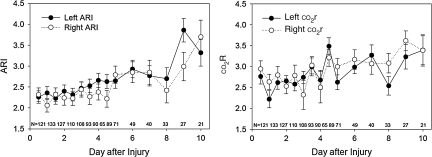
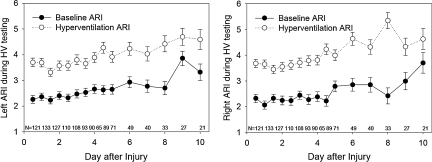
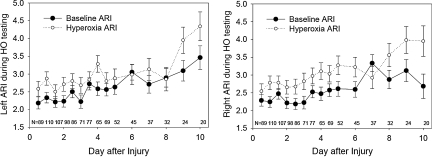
The purpose of this study was to examine the effects of hyperventilation or hyperoxia on cerebral hemodynamic parameters over time in patients with severe traumatic brain injury (TBI). We prospectively studied 186 patients with severe TBI. CO₂ and O₂ reactivity tests were conducted twice a day on days 1-5 and once daily on days 6-10 after injury. During hyperventilation there was a significant decrease in intracranial pressure (ICP), mean arterial pressure (MAP), jugular venous oxygen saturation (Sjvo₂), brain tissue Po₂ (Pbto₂), and flow velocity (FV). During hyperoxia there was an increase in Sjvo₂ and Pbto₂, and a small but consistent decrease in ICP, end-tidal carbon dioxide (etco₂), partial arterial carbon dioxide pressure (Paco₂), and FV. Brain tissue oxygen reactivity during the first 12 h after injury averaged 19.7 ± 3.0%, and slowly decreased over the next 7 days. The autoregulatory index (ARI; normal = 5.3 ± 1.3) averaged 2.2 ± 1.5 on day 1 post-injury, and gradually improved over the 10 days of monitoring. The ARI significantly improved during hyperoxia, by an average of 0.4 ± 1.8 on the left, and by 0.5 ± 1.8 on the right. However, the change in ARI with hyperoxia was much smaller than that observed with hyperventilation. Hyperventilation increased ARI by an average of 1.3 ± 1.9 on the left, and 1.5 ± 2.0 on the right. Pressure autoregulation, as assessed by dynamic testing, was impaired in these head-injured patients. Acute hyperoxia significantly improved pressure autoregulation, although the effect was smaller than that induced by hyperventilation. The very small change in Paco₂ induced by hyperoxia does not appear to explain this finding. Rather, the vasoconstriction induced by acute hyperoxia may allow the cerebral vessels to respond better to transient hypotension. Further studies are needed to define the clinical significance of these observations.
Figures
Similar articles
-
Pressure autoregulation, intracranial pressure, and brain tissue oxygenation in children with severe traumatic brain injury.J Neurosurg Pediatr. 2009 Nov;4(5):420-8. doi: 10.3171/2009.6.PEDS096. J Neurosurg Pediatr. 2009. PMID: 19877773
-
Effect of transient moderate hyperventilation on dynamic cerebral autoregulation after severe head injury.Neurosurgery. 1996 Jul;39(1):35-43; discussion 43-4. doi: 10.1097/00006123-199607000-00008. Neurosurgery. 1996. PMID: 8805138
-
Effect of hyperoxia on cerebral metabolic rate for oxygen measured using positron emission tomography in patients with acute severe head injury.J Neurosurg. 2007 Apr;106(4):526-9. doi: 10.3171/jns.2007.106.4.526. J Neurosurg. 2007. PMID: 17432700 Clinical Trial.
-
Cerebral pressure autoregulation in traumatic brain injury.Neurosurg Focus. 2008 Oct;25(4):E7. doi: 10.3171/FOC.2008.25.10.E7. Neurosurg Focus. 2008. PMID: 18828705 Review.
-
Hyperventilation therapy for severe traumatic brain injury.New Horiz. 1995 Aug;3(3):439-47. New Horiz. 1995. PMID: 7496752 Review.
Cited by
-
Monitoring of brain and systemic oxygenation in neurocritical care patients.Neurocrit Care. 2014 Dec;21 Suppl 2:S103-20. doi: 10.1007/s12028-014-0024-6. Neurocrit Care. 2014. PMID: 25208670 Review.
-
Temporal profile of intracranial pressure and cerebrovascular reactivity in severe traumatic brain injury and association with fatal outcome: An observational study.PLoS Med. 2017 Jul 25;14(7):e1002353. doi: 10.1371/journal.pmed.1002353. eCollection 2017 Jul. PLoS Med. 2017. PMID: 28742817 Free PMC article.
-
Cerebral blood flow and transcranial doppler sonography measurements of CO2-reactivity in acute traumatic brain injured patients.Neurocrit Care. 2014 Feb;20(1):54-9. doi: 10.1007/s12028-012-9727-8. Neurocrit Care. 2014. PMID: 22700360
-
Hyperventilation in Adult TBI Patients: How to Approach It?Front Neurol. 2021 Jan 28;11:580859. doi: 10.3389/fneur.2020.580859. eCollection 2020. Front Neurol. 2021. PMID: 33584492 Free PMC article. Review.
-
Critical thresholds for transcranial Doppler indices of cerebral autoregulation in traumatic brain injury.Neurocrit Care. 2011 Apr;14(2):188-93. doi: 10.1007/s12028-010-9492-5. Neurocrit Care. 2011. PMID: 21181299
References
-
- Aaslid R. Lindegaard K.F. Sorteberg W. Nornes H. Cerebral autoregulation dynamics in humans. Stroke. 1989;20:45–52. - PubMed
-
- Albrecht R.F. Miletich D.J. Ruttle M. Cerebral effects of extended hyperventilation in unanesthetized goats. Stroke. 1987;18:649–655. - PubMed
-
- Amano T. Meyer J.S. Okabe T. Shaw T. Mortel K.F. Cerebral vasomotor responses during oxygen inhalation. Results in normal aging and dementia. Arch. Neurol. 1983;40:277–282. - PubMed
-
- Diringer M.N. Aiyagari V. Zazulia A.R. Videen T.O. Powers W.J. Effect of hyperoxia on cerebral metabolic rate for oxygen measured using positron emission tomography in patients with acute severe head injury. J. Neurosurg. 2007;106:526–529. - PubMed
-
- Djurberg H.G. Seed R.F. Evans D.A. Brohi F.A. Pyper D.L. Tjan G.T. al Moutaery K.R. Lack of effect of CO2 on cerebral arterial diameter in man. J. Clin. Anesth. 1998;10:646–651. - PubMed
Publication types
MeSH terms
Grants and funding
LinkOut - more resources
Full Text Sources
Other Literature Sources
Medical
