. 2010 Aug 4:9:207.
doi: 10.1186/1476-4598-9-207.

Cathepsin B inhibition interferes with metastatic potential of human melanoma: an in vitro and in vivo study

Affiliations

Cathepsin B inhibition interferes with metastatic potential of human melanoma: an in vitro and in vivo study

Paola Matarrese et al. Mol Cancer. .

Abstract

Background: Cathepsins represent a group of proteases involved in determining the metastatic potential of cancer cells. Among these are cysteinyl- (e.g. cathepsin B and cathepsin L) and aspartyl-proteases (e.g. cathepsin D), normally present inside the lysosomes as inactive proenzymes. Once released in the extracellular space, cathepsins contribute to metastatic potential by facilitating cell migration and invasiveness.

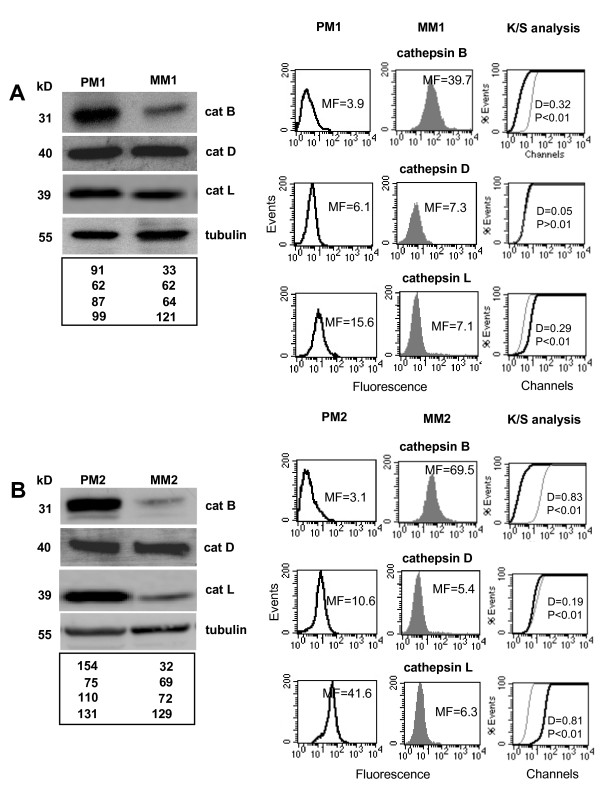
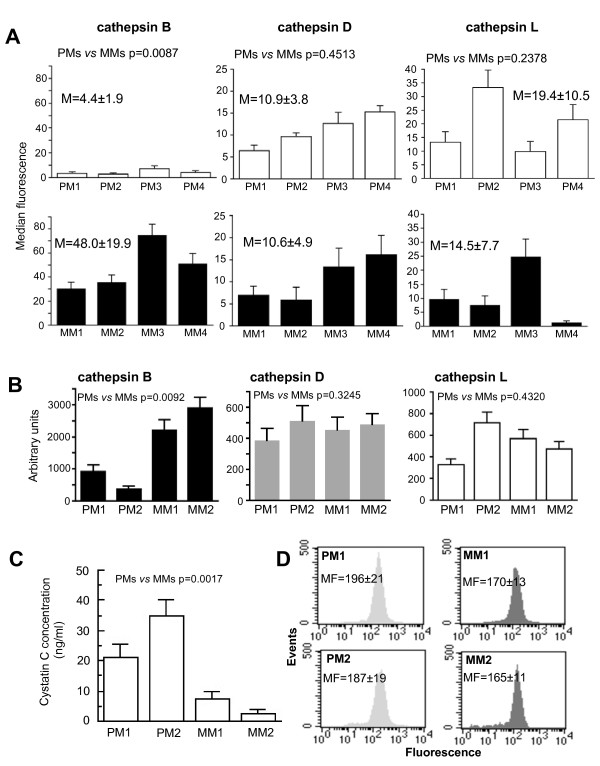
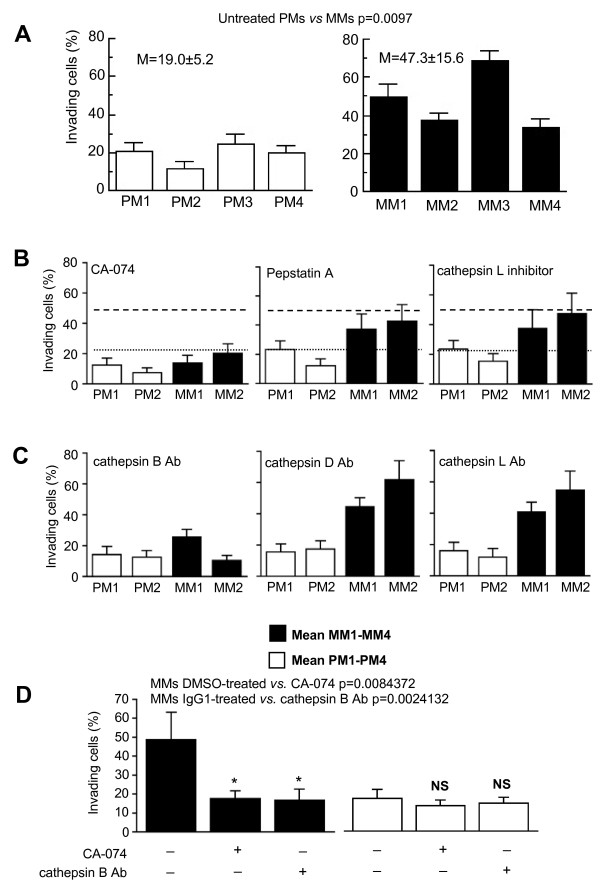
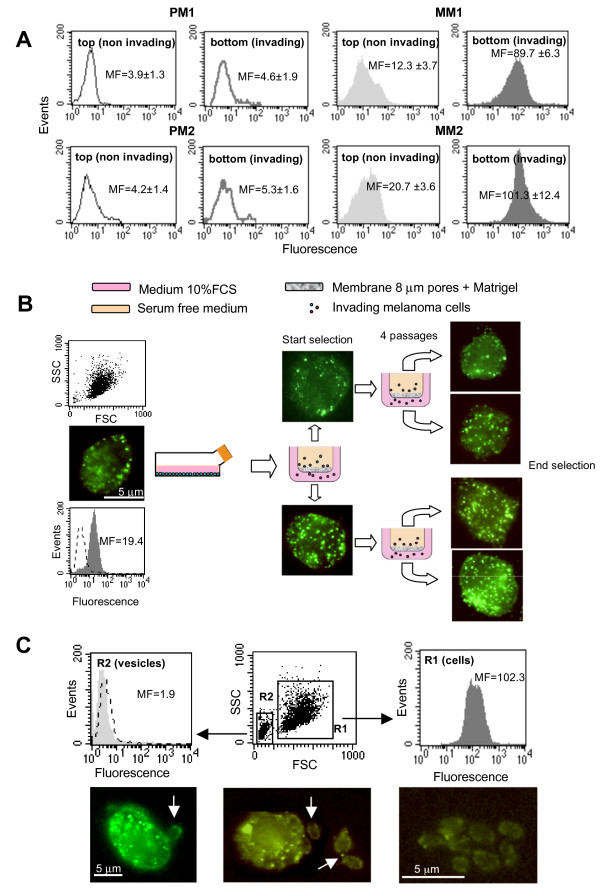
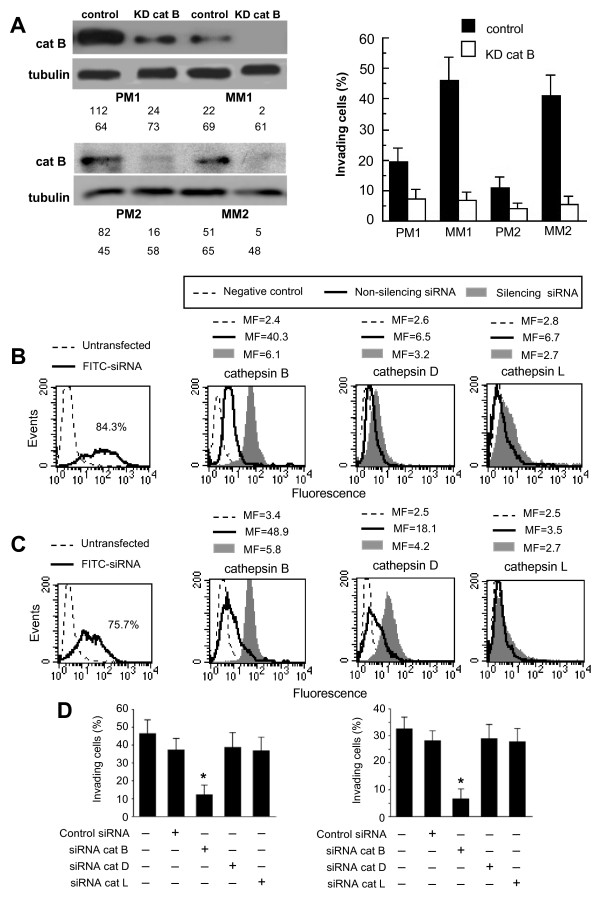
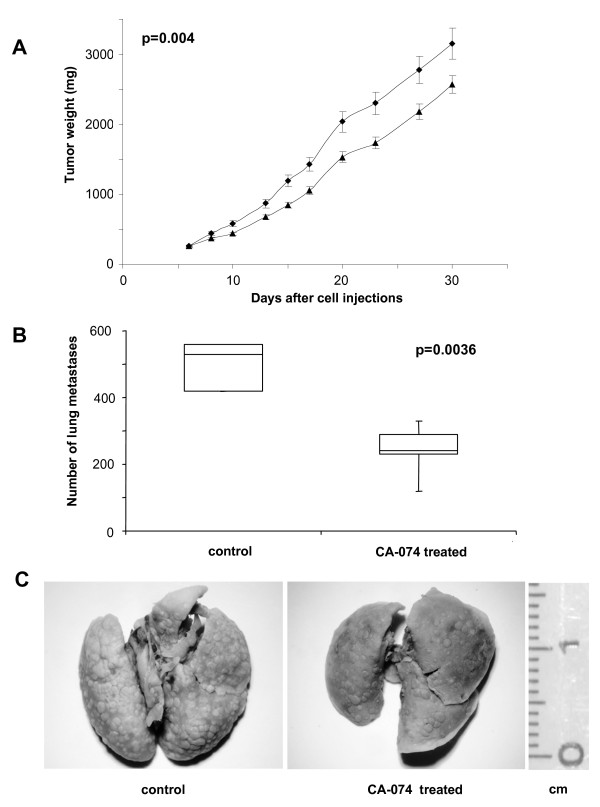
Results: In the present work we first evaluated, by in vitro procedures, the role of cathepsins B, L and D, in the remodeling, spreading and invasiveness of eight different cell lines: four primary and four metastatic melanoma cell lines. Among these, we considered two cell lines derived from a primary cutaneous melanoma and from a supraclavicular lymph node metastasis of the same patient. To this purpose, the effects of specific chemical inhibitors of these proteases, i.e. CA-074 and CA-074Me for cathepsin B, Cathepsin inhibitor II for cathepsin L, and Pepstatin A for cathepsin D, were evaluated. In addition, we also analyzed the effects of the biological inhibitors of these cathepsins, i.e. specific antibodies, on cell invasiveness. We found that i) cathepsin B, but not cathepsins L and D, was highly expressed at the surface of metastatic but not of primary melanoma cell lines and that ii) CA-074, or specific antibodies to cathepsin B, hindered metastatic cell spreading and dissemination, whereas neither chemical nor biological inhibitors of cathepsins D and L had significant effects. Accordingly, in vivo studies, i.e. in murine xenografts, demonstrated that CA-074 significantly reduced human melanoma growth and the number of artificial lung metastases.

Conclusions: These results suggest a reappraisal of the use of cathepsin B inhibitors (either chemical or biological) as innovative strategy in the management of metastatic melanoma disease.


Figures

Figure 1
Figure 1
Cathepsin B expression in cells from primary and metastatic human melanomas. Western blot analysis (left panels) of cathepsin B, cathepsin D, cathepsin L and tubulin in the primary melanoma cell lines PM1 (A) and PM2 (B) and in the metastatic melanoma cell lines MM1 (A) and MM2 (B). Quantitative flow cytometry analysis (right panels) of plasma membrane cathepsin B in PM1 (A) and PM2 (B) cell lines and in MM1 (A) and MM2 (B) cell lines. The values of Western blot signals, reported in the bottom panels of (A) and (B), were obtained by densitometric analysis and expressed as arbitrary units (a.u.). Numbers in the right panels of (A) and (B) represent the median fluorescence values. In the right panels of (A) and (B) statistical analysis performed by non-parametric K/S test is reported.
Figure 2
Figure 2
Cathepsin activity and cystatin C amount in primary and metastatic human melanoma cells. (A) Quantitative cytofluorimetric analysis of plasma membrane cathepsin B, D and L in four different primary (white columns) and metastatic (black columns) melanoma cell lines. Numbers represent the mean values among four different primary or metastatic melanoma cell lines analyzed. (B) Fluorimetric assays for cathepsin B (black columns), cathepsin D (grey columns) and cathepsin L (white columns) activity in the cell medium of two representative primary and metastatic melanoma cell lines. Results are reported as fluorescence units. (C) Concentration of cystatin C in the growth medium of two representative primary and metastatic melanoma cell lines obtained by ELISA test. Results are reported as ng/ml. (*) p < 0.01 for PM cell lines vs. MM cell lines by Student's t-test. (D) Quantitative cytofluorimetric analysis of cystatin C intracellular content in two representative primary (light grey histograms) and metastatic (deep grey histograms) melanoma cell lines. Numbers represent the median fluorescence values ± SD among four independent measurements. Histograms from a representative experiment are shown.
Figure 3
Figure 3
Cathepsins and in vitro invasiveness: effect of chemical and biological inhibitors. (A) Invasion test on primary (white columns) and metastatic (black columns) melanoma cell lines. (B) Invasion test on two representative cell lines from primary (white columns) and metastatic (black columns) melanoma in the presence of CA-074 (left panel), Pepstatin A (central panel) or cathepsin L inhibitor (right panel). Dotted lines represent the mean of the results obtained in primary melanoma cell lines, and dashed lines indicate the mean of the results obtained in metastatic melanoma cell lines by using DMSO (vehicle of the cathepsin inhibitors). (C) Invasion test on two representative cell lines from primary (white columns) and metastatic (black columns) melanoma in the absence or in the presence of specific antibodies against cathepsin B (left panel), cathepsin D (central panel) or cathepsin L (right panel). Dotted lines represent the mean of the results obtained in primary melanoma cell lines, and dashed lines indicate the mean of the results obtained in metastatic melanoma cell lines by using IgG1 as positive control. (D) Histogram showing the results obtained from four different primary melanoma (white columns) or metastatic melanoma (black columns) cell lines in the absence or in the presence of CA-074 or antibodies against cathepsin B. Data are reported as mean ± SD of the percentage of invading cells. Student's t-test indicates: p = 0.0097 for untreated MM cells vs. CA-074-treated MM cells and p = 0.0030 for untreated MM cells vs. MM cells treated with anti-cathepsin B antibodies.
Figure 4
Figure 4
Cathepsin B surface expression and in vitro invasiveness. (A) Quantitative flow cytometry analysis of plasma membrane cathepsin B in PM1 and PM2 cell lines (empty histograms) and in MM1 and MM2 cell lines (full histograms) performed in cells found above (non invading) or below (invading) the Matrigel covered filter. Numbers represent the median fluorescence values ± SD among three independent measurements. Histograms from a representative experiment are shown. (B) Cytofluorimetric and fluorescence microscopy analyses of plasma membrane cathepsin B in MM4 cell line during selection of invading cells by repeated passages through the Matrigel-covered filters. (C) Cytofluorimetric analysis of plasma membrane cathepsin B in MM4 cells at the end of the selection after four passages through the Matrigel-covered filters revealed the presence of a sub-population with reduced size (R2 region, bottom central panel) and negative to cathepsin B (bottom left panel). In the bottom panels fluorescence microscopy micrographs showing cathepsin B-positive cells (corresponding to R1 region) and cathepsin B-negative microvesicles, probably corresponding to the sub-population (R2 region) revealed by cytofluorimetric analysis. Arrows indicate vesicles budding from (left picture) or near to (central picture) the cell. In the right panel a cluster of vesicles is shown.
Figure 5
Figure 5
Cathepsins and in vitro invasiveness: effect of siRNA. (A) Western blot analysis of cathepsin B (left panels) and invasion test (right panel) of cells knocked down for cathepsin B in two different primary (PM1 and PM2) and metastatic (MM1 and MM2) melanoma cell lines. The values of Western blot signals, reported in the bottom left panels, were obtained by densitometric analysis and are expressed as arbitrary units (a.u.). In vitro invasion test (right panel) in cells knocked down for cathepsin B showed a significant (p < 0.01) reduction of their invasion capability. Data are reported as mean ± SD of the percentage of invading cells obtained in three independent experiments. Two representative primary or metastatic melanoma cell lines are shown. (B and C) Flow cytometry evaluation of fluorescence in MM1 cells (B) or MM4 cells (C) transfected with FITC-siRNA. The number in the left panel represents the percentage of FITC-positive cells (corresponding to transfected cells). Cytofluorimetric evaluation, performed 48 h after transfection, of cathepsin B (second panel), D (third panel) or L (fourth panel) in MM1 (B) and MM4 (C) cells transfected with non-silencing siRNA or with silencing siRNA. Numbers represent the median fluorescence intensity and indicate the expression level of the cathepsins. A representative experiment among three is shown. (D) Invasion test of cells knocked down for cathepsins in MM1 (left panel) and in MM4 (right panel) cell lines. (*) Indicates p < 0.01.
Figure 6
Figure 6
Antitumor efficacy of CA-074 in human melanoma xenografts. (A) Tumor growth curves of mice bearing MM1 melanoma cells and treated i.v. with vehicle alone (υ) or with CA-074 (σ) for eight consecutive days, starting from day 6 after cell injection. Mean tumor weights in mg ± SD are shown. (B) Mice were injected i.v. with MM4 cells and the day after, treated with CA-074 for eight consecutive days. At day 14 after cells injection, lungs were removed and fixed in Bouin's solution to distinguish tumor nodules from lung tissue, and the number of metastases was evaluated. The boxes show medians and 75th and 25th percentiles of the data, while the whiskers indicate the minimum and maximum values. (C) Representative images of metastatic nodules in lungs from control and treated mice. Note the lower number of nodules in the right picture.

Similar articles

Cited by

References

    1. Vasiljeva O, Reinheckel T, Peters C, Turk D, Turk V, Turk B. Emerging roles of cysteine cathepsins in disease and their potential as drug targets. Curr Pharm Des. 2007;13:387–403. doi: 10.2174/138161207780162962. - DOI - PubMed
    1. Vasiljeva O, Turk B. Dual contrasting roles of cysteine cathepsins in cancer progression: apoptosis versus tumour invasion. Biochimie. 2008;90:380–386. doi: 10.1016/j.biochi.2007.10.004. - DOI - PubMed
    1. Guicciardi ME, Leist M, Gores GJ. Lysosomes in cell death. Oncogene. 2004;23:2881–2890. doi: 10.1038/sj.onc.1207512. - DOI - PubMed
    1. Szpaderska AM, Frankfater A. An intracellular form of cathepsin B contributes to invasiveness in cancer. Cancer Res. 2001;6:3493–3500. - PubMed
    1. Podgorski I, Sloane BF. Cathepsin B and its role(s) in cancer progression. Biochem Soc Symp. 2003;70:263–276. - PubMed

Publication types