. 2010 Aug 4:11:413.
doi: 10.1186/1471-2105-11-413.

Nonparametric identification of regulatory interactions from spatial and temporal gene expression data

Affiliations

Nonparametric identification of regulatory interactions from spatial and temporal gene expression data

Anil Aswani et al. BMC Bioinformatics. .

Abstract

Background: The correlation between the expression levels of transcription factors and their target genes can be used to infer interactions within animal regulatory networks, but current methods are limited in their ability to make correct predictions.

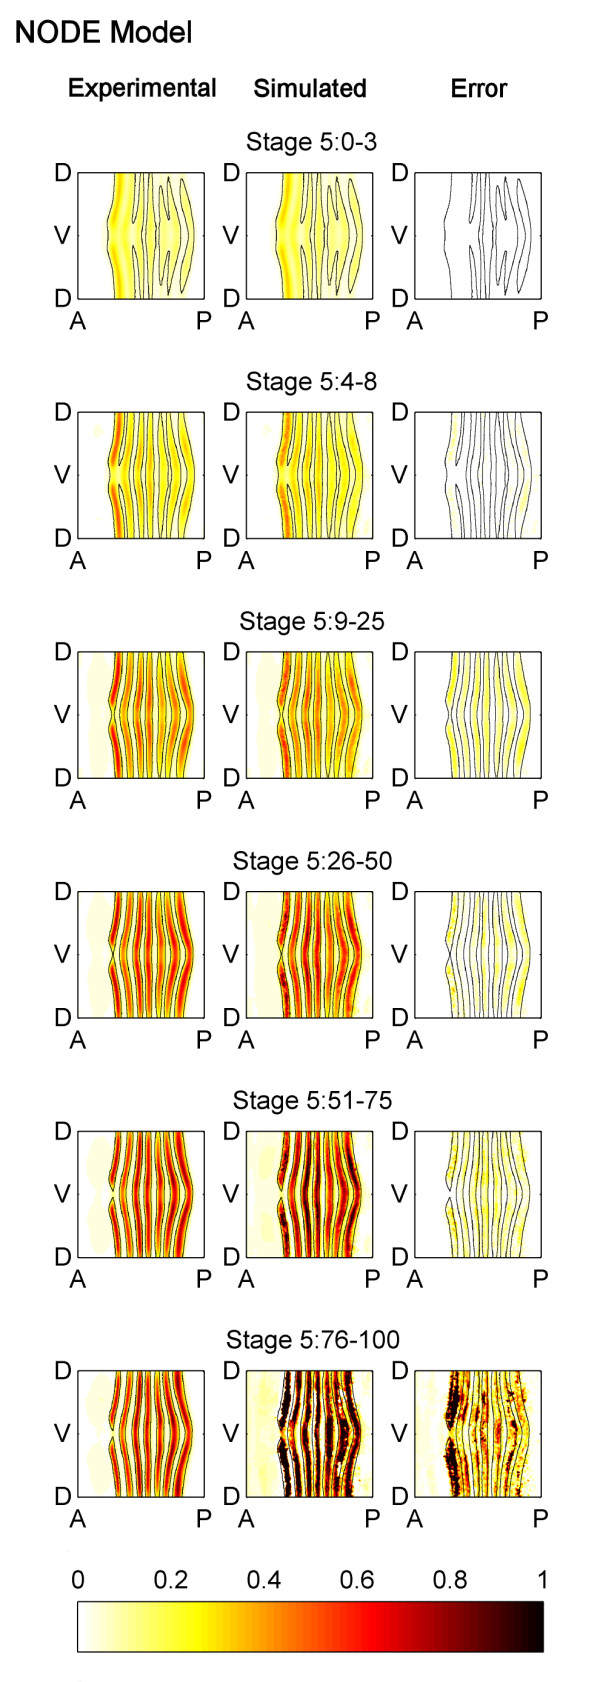
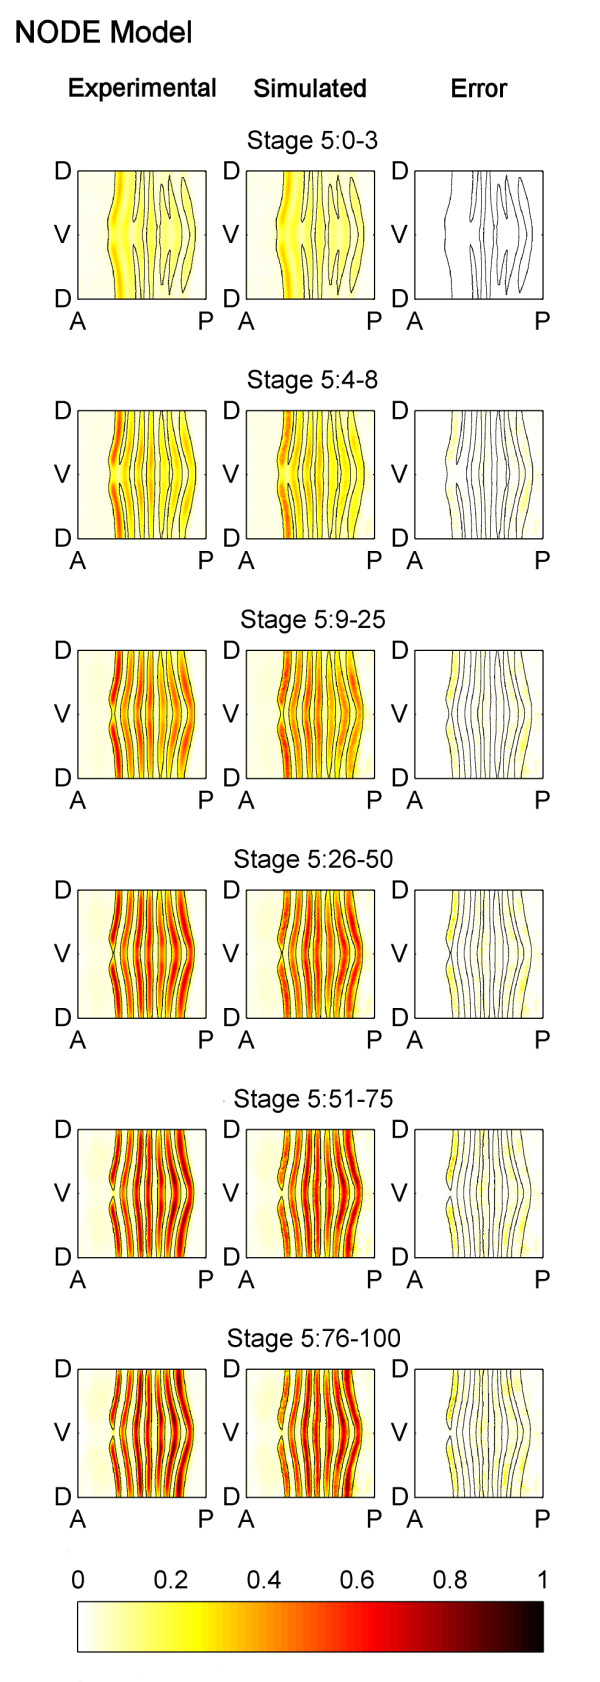
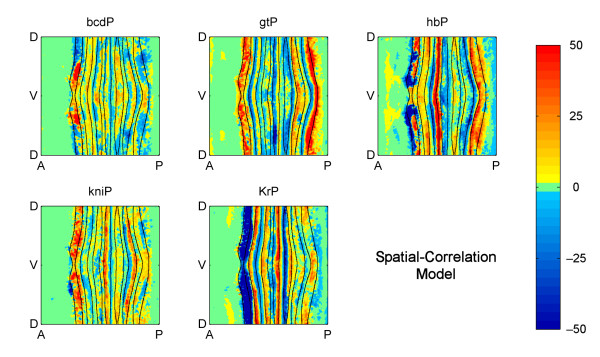
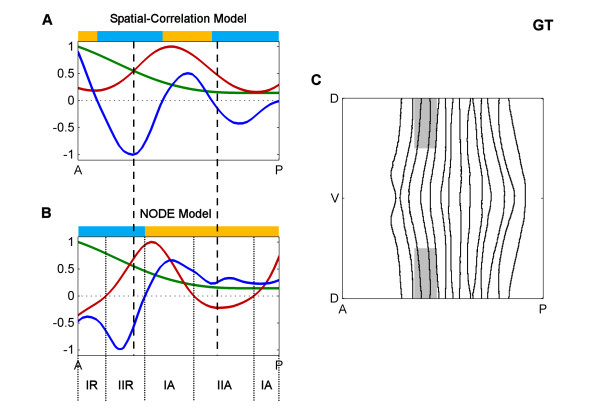
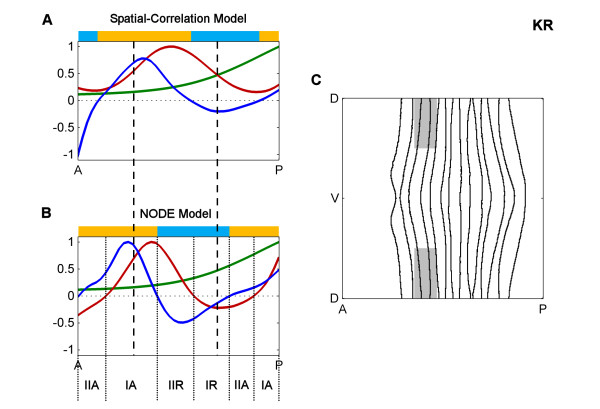
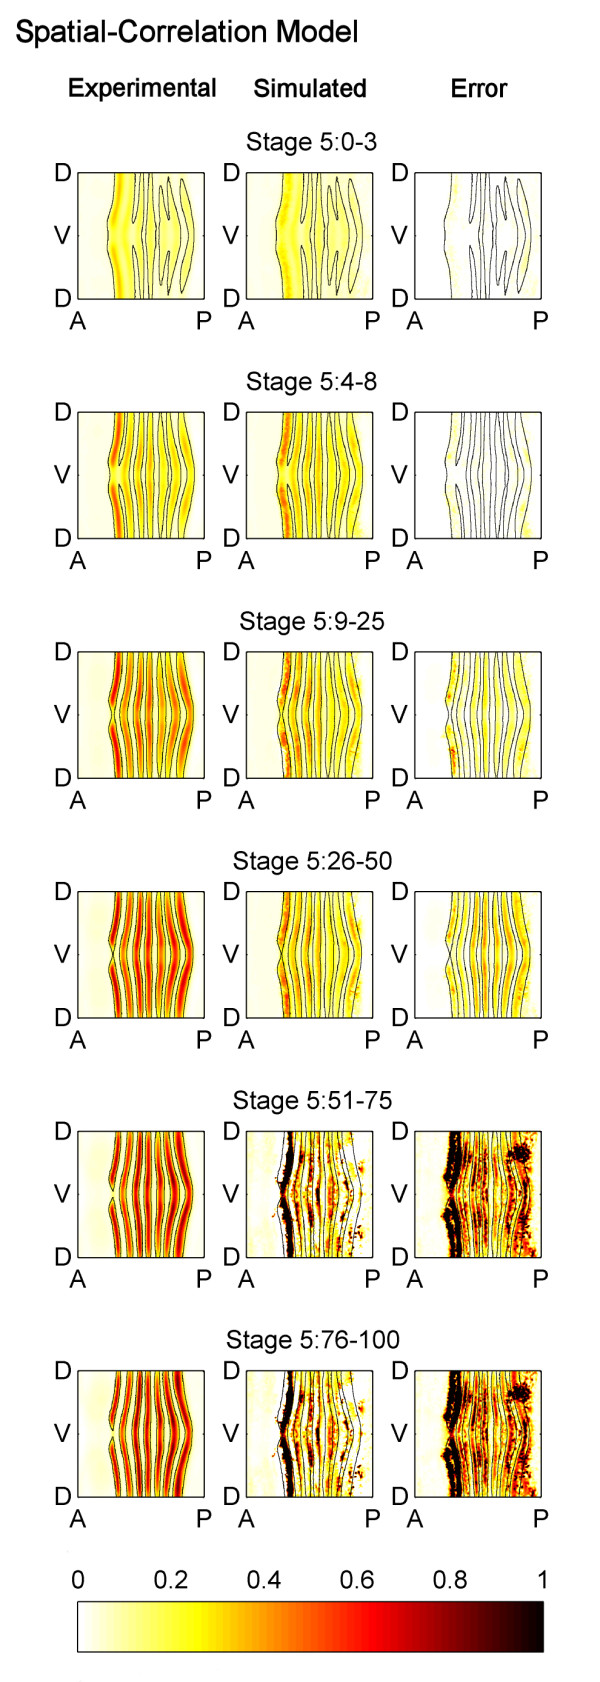
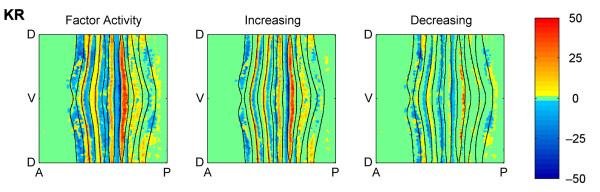
Results: Here we describe a novel approach which uses nonparametric statistics to generate ordinary differential equation (ODE) models from expression data. Compared to other dynamical methods, our approach requires minimal information about the mathematical structure of the ODE; it does not use qualitative descriptions of interactions within the network; and it employs new statistics to protect against over-fitting. It generates spatio-temporal maps of factor activity, highlighting the times and spatial locations at which different regulators might affect target gene expression levels. We identify an ODE model for eve mRNA pattern formation in the Drosophila melanogaster blastoderm and show that this reproduces the experimental patterns well. Compared to a non-dynamic, spatial-correlation model, our ODE gives 59% better agreement to the experimentally measured pattern. Our model suggests that protein factors frequently have the potential to behave as both an activator and inhibitor for the same cis-regulatory module depending on the factors' concentration, and implies different modes of activation and repression.

Conclusions: Our method provides an objective quantification of the regulatory potential of transcription factors in a network, is suitable for both low- and moderate-dimensional gene expression datasets, and includes improvements over existing dynamic and static models.


Figures

Figure 1
Figure 1
Quantitative cellular resolution 3 D gene expression. A. A three-dimensional plot of the Drosophila embryo showing the experimentally measured pattern of eve mRNA as it appears in late Stage 5. There are seven distinct expression stripes located along the anterior-posterior axis (AP) of the embryo, with the intensity of each stripe varying moderately along the dorsal-ventral axis (DV). B. A two-dimensional cylindrical projection of a Stage 5 Drosophila embryo provides an easier visualization of the details of the eve mRNA patterns, showing that expression of each stripe is similar on either side of the ventral mid line (V).
Figure 2
Figure 2
Comparison of the experimentally measured and the NODE model simulated patterns of eve mRNA. Cylindrical projections of the measured pattern of eve mRNA concentrations (left column), the NODE model simulated pattern of eve mRNA (center column), and the simulation error (right column) at six successive time points during blastoderm Stage 5 (rows). The eve mRNA concentration values have been normalized to range from 0 to 1 and the simulation error shown is the absolute value of the difference between experimental and simulated eve concentration in the embryo. The NODE model was generated using only data from Stage 5:0-3 and Stage 5:4-8, and the data from Stage 5:0-3 was used as the initial condition for simulation. It is able to predict the expression pattern well except for Stage 5:76-100.
Figure 3
Figure 3
Comparison of the experimentally measured and the NODE model (generated using eve mRNA expression from all time points) simulated patterns of eve mRNA. A NODE model was generated using data from all time points in Stage 5, and it was used to predict the expression pattern. The simulation of this model shows better agreement with the experimentally observed pattern, than the NODE model shown in Figure 2 (which only uses two time points to generate the model). The figure is labelled using the same conventions as Figure 2 except that the simulation and error are for the NODE model which uses all time points.
Figure 4
Figure 4
Embryo wide factor activity at Stage 5:9-25 predicted by the NODE model. Cylindrical projections of the correlation between each factor and the change in target expression over time. The intensity of the factor activity values is the product of the coefficients of the model in Equation 4 and the average, local factor concentration. The mathematical definition of factor activity is given in Methods and Models.
Figure 5
Figure 5
Embryo wide factor activity at Stage 5:9-25 predicted by the spatial-correlation model. Cylindrical projections of the correlations between each factor and the target expression. The intensity of the factor activity values is the product of the coefficients of the model in Equation 5 and the average, local factor concentration. The mathematical definition of factor activity is given in Methods and Models.
Figure 6
Figure 6
Comparison of spatial-correlation and NODE models for GT at Stage 5:9-25. A. The spatial correlation model along part of the anterior-posterior (AP) axis. Plotted are the concentrations of GT protein (green line) and eve mRNA (red line) as well as the factor activity of GT in the "spatial-correlation" model (dark blue line), calculated via a joint correlation of all factors with eve mRNA. The vertical dashed lines indicate the boundaries of eve stripe 2. The colored bars above indicate where the factor activity is positive (yellow) or negative (light blue). B. The NODE model along part of the AP axis. Plotted are the concentrations of GT protein (green line) and the change in eve mRNA over time (red line) as well as the factor activity of GT in the NODE model (dark blue line), calculated via a joint correlation of all factors with the change in eve mRNA. The vertical dashed lines indicate the boundaries of eve stripe 2. The regions of the embryo where GT is a type I or II activator or a type I or II repressor are indicated (IA, IIA, IR or IIR), and they are indicated with dotted lines. The colored bars above indicate where the factor activity is positive (yellow) or negative (light blue). C. The portion of the embryo that is plotted in A and B is shown in gray. The ventral region is omitted because otherwise the spatial variation of eve concentration along the dorsal-ventral (DV) axis makes interpretation of one-dimensional plots difficult. The values in the one-dimensional plots of A and B were generated by averaging over the DV axis and is done for strictly for visualization purposes. This averaging is not used in our standard analyses or method.
Figure 7
Figure 7
Comparison of spatial correlation and NODE models for KR at Stage 5:9-25. A. The spatial correlation model along part of the anterior-posterior (AP) axis. B. The NODE model along part of the AP axis. C. The portion of the embryo which is plotted in A and B. The figure is labeled using the same conventions as Figure 5 except that the protein expression and models are for KR protein.
Figure 8
Figure 8
Comparison of the experimentally measured and the spatial-correlation model simulated patterns of eve mRNA. A spatial-correlation model was generated using only data from Stage 5:0-3 and Stage 5:4-8, and it was used to predict the expression pattern during later portions of Stage 5. The spatial-correlation model is unable to predict the expression pattern well, and is not as accurate as the NODE model which is shown in Figure 2. The figure is labelled using the same conventions as Figure 2 except that the simulation and error are for the spatial-correlation model.
Figure 9
Figure 9
Locations of type I and II activation and repression of eve by GT. The factor activity of GT protein on eve as predicted by the NODE model is shown (left). The "Increasing" plot shows type I activation in yellow/red and type II repression in blue for cells where eve mRNA is increasing over time (center). The "Decreasing" plot shows type I repression in blue and type II activation in yellow/red for cells where eve mRNA is decreasing over time (right).
Figure 10
Figure 10
Locations of type I and II activation and repression of eve by KR. The figure is labelled using the same conventions as Figure 7 except that the models are for the factor activity of KR protein on eve.
Figure 11
Figure 11
Window of cells with similar concentrations. The cell which represents x[t, e] is shown in red, and a purple line points towards this cell. The window of cells with similar factor concentrations is shown in gray, and cells farther away from the red-colored cell are less similar. Cells with more similar concentrations are shown by darker shades of gray, and cells not in the window are colored white. The black lines show the boundaries of the experimental eve pattern. The NODE method takes the amount of similarity of the cells into account when doing the regression procedure.

Similar articles

Cited by

References

    1. Bansal M, Belcastro V, Ambesi-Impiombato A, di Bernardo D. How to infer gene networks from expression profiles. Molecular Systems Biology. 2007;3(78) - PMC - PubMed
    1. Markowetz F, Spang R. Inferring cellular networks - a review. BMC Bioinformatics. 2007;8(Suppl 6):S5. doi: 10.1186/1471-2105-8-S6-S5. http://www.biomedcentral.com/1471-2105/8/S6/S5 - DOI - PMC - PubMed
    1. Eisen M, Spellman P, Brown P, Botstein D. Cluster analysis and display of genome-wide expression patterns. PNAS. 1998;98:14863–14868. doi: 10.1073/pnas.95.25.14863. - DOI - PMC - PubMed
    1. Stuart J, Segal E, Koller D, Kim S. A gene-coexpression network for global discovery of conserved genetic modules. Science. 2003;302(5643):249–255. doi: 10.1126/science.1087447. - DOI - PubMed
    1. Bickel D. Probabilities of spurious connections in gene networks: application to expression time series. Bioinformatics. 2005;21(7):1121–1128. doi: 10.1093/bioinformatics/bti140. - DOI - PubMed

Publication types