Review
. 2010 Sep;52(1):57-73.
doi: 10.1016/j.ymeth.2010.06.001. Epub 2010 Jun 8.

Dynamic fluorescence depolarization: a powerful tool to explore protein folding on the ribosome

Affiliations
Review

Dynamic fluorescence depolarization: a powerful tool to explore protein folding on the ribosome

Sarah A Weinreis et al. Methods. 2010 Sep.

Abstract

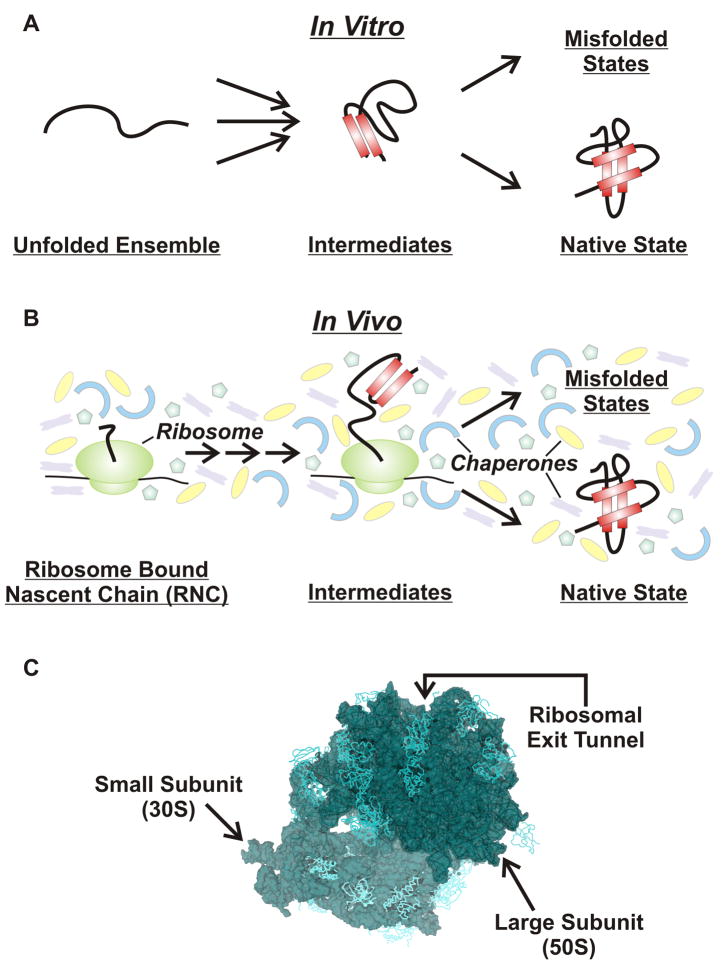
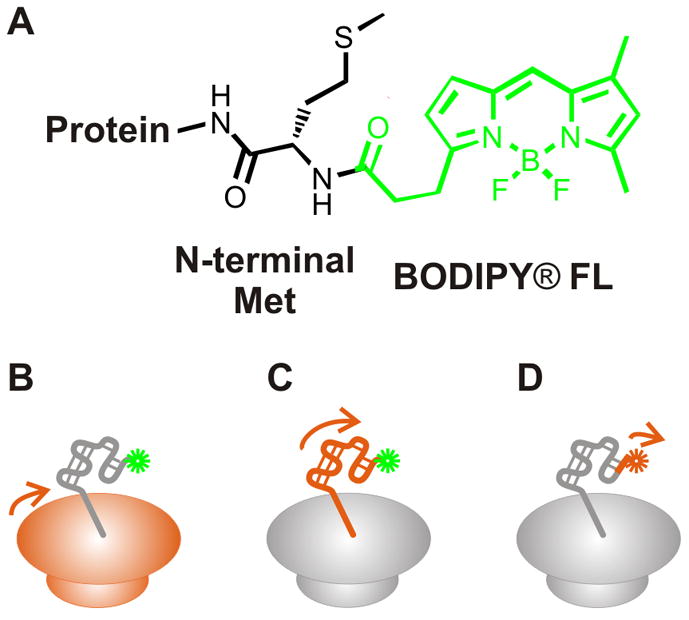
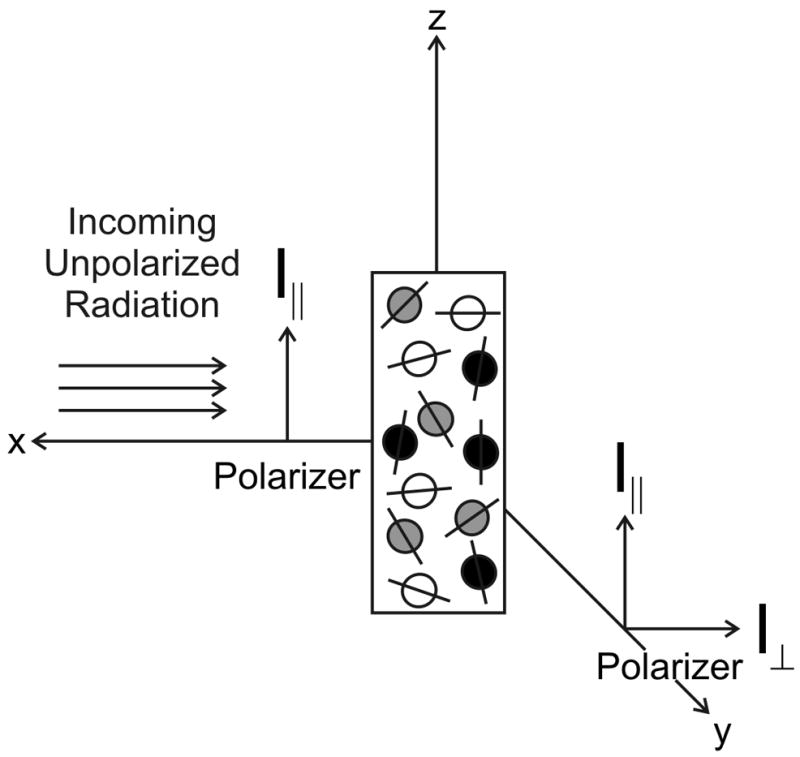
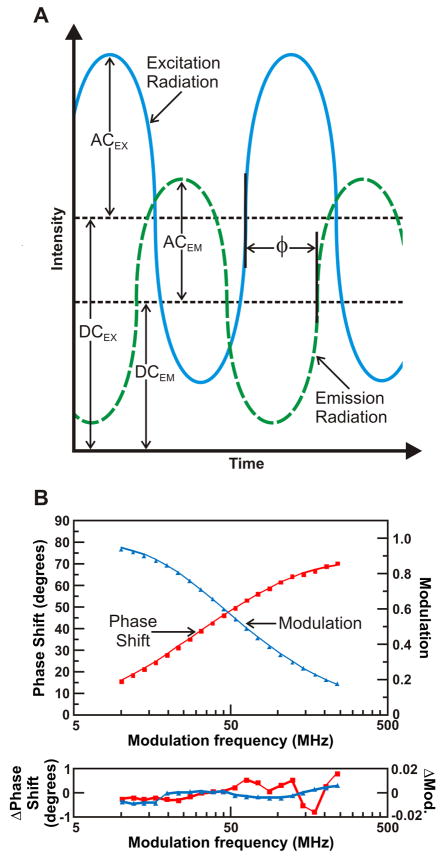
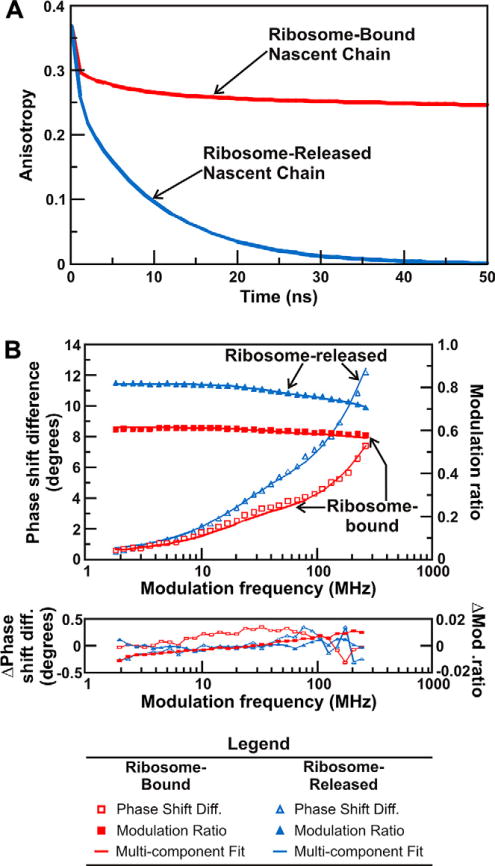
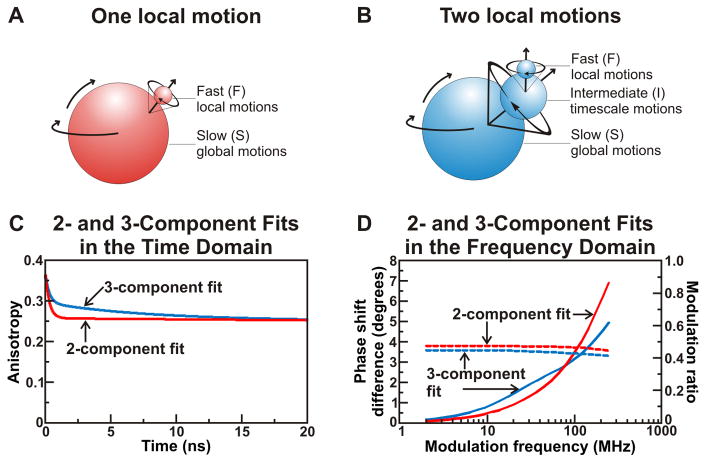
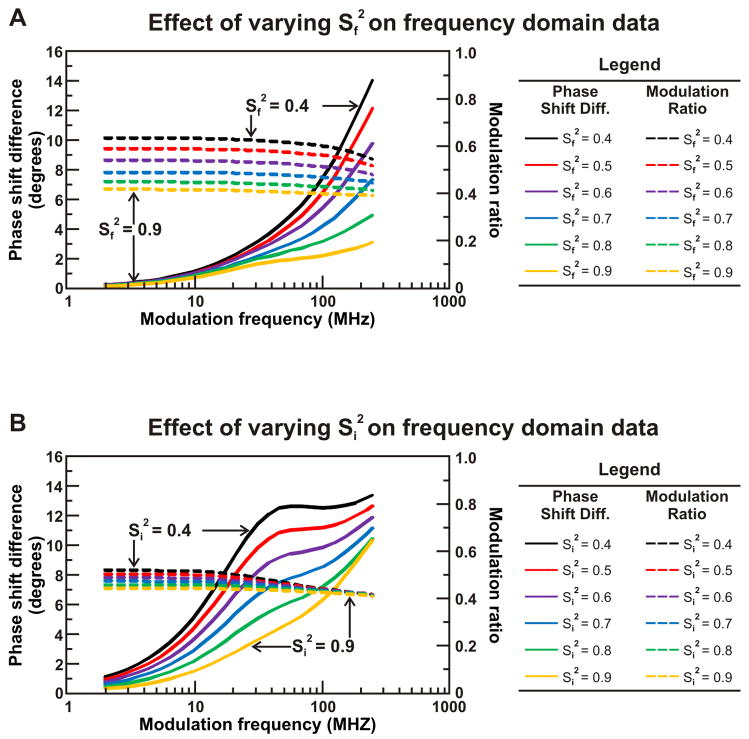
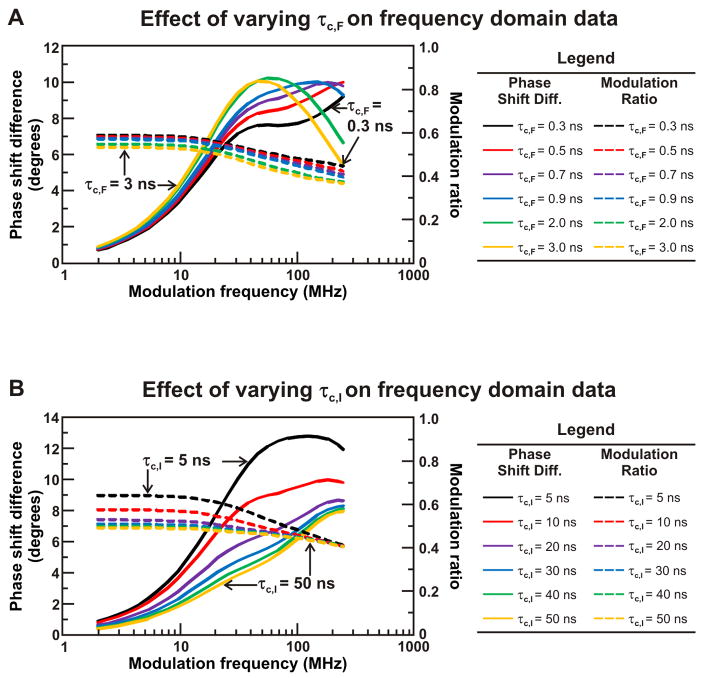
Protein folding is a fundamental biological process of great significance for cell function and life-related processes. Surprisingly, very little is presently known about how proteins fold in vivo. The influence of the cellular environment is of paramount importance, as molecular chaperones, the ribosome, and the crowded medium affect both folding pathways and potentially even equilibrium structures. Studying protein folding in physiologically relevant environments, however, poses a number of technical challenges due to slow tumbling rates, low concentrations and potentially non-homogenous populations. Early work in this area relied on biological assays based on antibody recognition, proteolysis, and activity studies. More recently, it has been possible to directly observe the structure and dynamics of nascent polypeptides at high resolution by spectroscopic and microscopic techniques. The fluorescence depolarization decay of nascent polypeptides labeled with a small extrinsic fluorophore is a particularly powerful tool to gain insights into the dynamics of newly synthesized proteins. The fluorophore label senses both its own local mobility and the motions of the macromolecule to which it is attached. Fluorescence anisotropy decays can be measured both in the time and frequency domains. The latter mode of data collection is extremely convenient to capture the nanosecond motions in ribosome-bound nascent proteins, indicative of the development of independent structure and folding on the ribosome. In this review, we discuss the theory of fluorescence depolarization and its exciting applications to the study of the dynamics of nascent proteins in the cellular environment.


Figures

Figure 1
Figure 1
Schematic representation of (A) in vitro and (B) in vivo protein folding pathways. Protein folding studies in vitro begin from a chemically or temperature induced unfolded ensemble and proceed through folding intermediates to either the native folded structure or misfolded/aggregated states. Protein folding in the cell differs from in vitro folding due to the influence of molecular chaperones, the ribosome and molecular crowding. (C) High resolution three-dimensional structure of the E. coli 70S ribosome (PDB codes 2AVY, 2AW4) [97].
Figure 2
Figure 2
Structure of the BODIPY® FL fluorophore covalently linked to the N-terminus of a protein (panel A). BODIPY® FL is one of several commercially available BODIPY fluorophores that can be used to probe protein dynamics. Fluorescence anisotropy decay measurements via a covalently attached fluorophore report on the (B) global tumbling of the ribosome, (C) the ns motions of the nascent protein, and (D) the fast local motions arising from the fluorophore. The motions described in panels B-D are highlighted in orange.
Figure 3
Figure 3
Illumination of a collection of randomly oriented fluorophores with vertically polarized radiation results in the photoselective excitation of fluorophores with transition dipoles aligned with the electric field vector of the polarized light. The fluorophores shown in black are most likely to be excited to the singlet electronic state, while those shaded in gray are less likely to absorb the polarized radiation. The white fluorophores have a very low probability of excitation. Anisotropy is measured my monitoring the vertically (I||) and horizontally (I) polarized components of the emitted fluorescence.
Figure 4
Figure 4
(A) Relationship between excitation and emission radiation in frequency-domain fluorescence spectroscopy demonstrating the origin of experimentally observed quantities. The AC represents the amplitude of the alternating current wave and the DC represents the direct current magnitude for the excitation (solid) and emission (dashed), respectively. The ratio of the AC components of the perpendicular and parallel emission is termed modulation ratio. φ defines the phase shift, while Δφ corresponds to the difference in phase between the perpendicular and parallel emission components. The frequency of the excitation light is constant, while the light intensity modulation frequency is varied in a frequency-domain anisotropy decay measurement. (B) FD fluorescence lifetime raw data, multicomponent fits, and curve fitting residuals for ribosome-bound full-length apoHmpH a prokaryotic globin protein [98]. Following resuspension, ATP (0.5 μM), KCl (100 mM), and the GrpE (0.4 μM) and DnaJ (0.4 μM) chaperones were added to the apoHmpH RNCs.
Figure 5
Figure 5
(A) Time-domain simulation illustrating the influence of the slow global tumbling of the ribosome on the observed anisotropy decay. Slow global tumbling prevents the anisotropy of ribosome-bound nascent chains from decaying to zero throughout the ns lifetime of the fluorophore. The anisotropy decays of nascent proteins released from the ribosome decay to zero within 50 ns. All simulations were performed with the Vinci software (ISS, Urbana Champaign). (B) Fluorescence depolarization raw data, multicomponent fits, and curve fitting residuals for ribosome-bound and ribosome-released full-length apoHmpH. The fit parameters derived from this FD anisotropy measurement are shown in Table 1.
Figure 6
Figure 6
The presence of one (panel A) or two (panel B) local motions can be discerned from the anisotropy decay of a fluorophore-labeled ribosome-bound nascent protein (RNC). Panels A and B illustrate the physical models underlying 2- and 3-component anisotropy decays of RNCs. In both cases, the slow global tumbling of the ribosome cannot be explicitly resolved. A 2-component decay corresponds to the presence of the local motion of the fluorophore in addition to the slow ribosomal tumbling, while a 3-component decay introduces an intermediate timescale motion diagnostic of protein folding on the ribosome. Panels C and D present simulated 2- and 3-component anisotropy decays in the time and frequency domains, respectively. Dashed and solid lines denote modulation ratios and phase shift differences, respectively. The 2-component anisotropy decays were simulated for a system with FS = 0.7, τS = 1000 ns, FF = 0.3, and τF = 0.3 ns. The parameters of the 3-component anisotropy decay simulations were set to FS = 0.7, τS = 1000 ns, FI = 0.1, τI = 7 ns, FF = 0.2, and τF = 0.3 ns. r0 was fixed at 0.37 for all simulations.
Figure 7
Figure 7
(A) Schematic representation of local (fast, F) and global (slow, S) motions. The local motion is modeled as a vector (μ⃗) colinear with either the emission or excitation dipoles of the fluorophore. The vector is allowed stochastic diffusion via wobbling motions within a static cone defined by semiangle θ0. The x-y component of the dynamics is randomized and therefore independent of the angle φ. In the case of two local motions, the intermediate timescale (I) motions can also be described as wobbling within a static cone defined by a separate semiangle. (B) Graphical representation of the dependence of the order parameter S and its square S2 on the cone semiangle θ0, according to the model of local motions in panel A.
Figure 8
Figure 8
Simulations highlighting the effect of rotational correlation time of the fast (panel A) and intermediate (panel B) timescale motions of a ribosome-bound nascent protein on anisotropy decay data in the frequency domain. The fundamental anisotropy r0 was fixed at 0.37, and the fractional contributions of each rotation were fixed simulation parameters (FS = 0.7, FI = 0.1, FF = 0.2). In panel A, τS was fixed at 1000 ns, τI was fixed at 7 ns, and τF was varied from 0.3 ns to 2 ns. In panel B, τS was fixed at 1000 ns, τF was fixed at 0.3 ns, and τI was varied from 5 ns to 30 ns.
Figure 9
Figure 9
Simulations highlighting the influence of the rotational restriction of the independent motions of the nascent protein and the local motions of the fluorophore on anisotropy decay data in the frequency domain. The effect of rotational restriction is simulated by ranging the order parameter of the fast (panel A) and intermediate (panel B) timescale motions. The fundamental anisotropy r0 was fixed at 0.37, and the rotational correlation times of each motion were fixed simulation parameters (τS = 1000 ns, τI = 7 ns, and τF = 0.3 ns). In panel A, the fractional contributions of each motion were varied such as to span a range of SF2 from 0.4 to 0.9 (eqn. 23). In panel B, FF was fixed at 0.2 while FS and FI were varied to describe the range of SI2 from 0.4 to 0.9.
Figure 10
Figure 10
Simulation of the anisotropy decay of a ribosome released protein illustrating the effect of the rotational correlation time of the fast (panel A) and intermediate (panel B) timescale motions on frequency domain data. The fundamental anisotropy r0 was fixed at 0.37 and the fractional contributions of each rotation were fixed simulation parameters (FI = 0.7, FF = 0.3). In panel A, τI was fixed at 10 ns and τF was varied from 0.3 ns to 3 ns. In panel B, τF was fixed at 0.7 ns and τI was varied from 5 ns to 50 ns.
Figure 11
Figure 11
Simulated effect of the order parameter (degree of rotational restriction) of the fast local fluorophore motions on simulated 2-component anisotropy decays in the frequency domain. The 2-component anisotropy decay is expected for a protein that has been released from the ribosome. The fundamental anisotropy r0 was fixed at 0.37, and the rotational correlation times of each motion were fixed simulation parameters (τI = 10 ns and τF = 0.7 ns). The fractional contributions of each motion were varied such as to span a range of SF2 from 0.4 to 0.9 (eqn. 22).
Figure 12
Figure 12
(A) A general ellipsoid features three unique axes a (green), b (red), and c (blue). The anisotropy decay of a general ellipsoid is expected to have multi-exponential character because the rotational diffusion coefficient about each of the three unique axes is different (D1, D2, and D3). (B) Prolate ellipsoids of revolution are characterized by a unique axis (green) which is longer than two axes of equal length (red), while in an oblate ellipsoid of revolution (panel C) the unique axis (green) is shorter than the duplicate axes (red).
Figure 13
Figure 13
Cartoon representations of ribosome-bound nascent polypeptides in the absence and presence of molecular chaperones. (A) In a wild-type cell free system, it is challenging to discern the multiple populations which may arise from various interations with the different chaperones. (B) The challenge of multiple populations can be overcome by employing a Δtig plasmid which lacks trigger factor and flushing the system with GrpE and ATP to eliminate interactions with DnaK to generate a population of chaperone-free RNCs. RNC interactions with chaperones can be then be probed independently by saturating the chaperone-free system with DnaK and trigger factor.
Figure 14
Figure 14
Fluorescence depolarization raw data, multicomponent fits, and curve fitting residuals for ribosome-bound and ribosome-released PIR90. Release of nascent PIR90 from the ribosome induces the formation of a significantly more dynamic species, as illustrated by the variations in the modulation ratio and phase shift difference profiles.
Figure 15
Figure 15
(A) Cartoon illustrating the release of a nascent protein from the ribosome. This process occurs in Nature when the ribosome reaches an mRNA stop codon and appropriate release factors promote nascent chain departure. Ribosome release of nascent proteins can also be triggered ad hoc, upon addition of selected agents to stalled ribosomes. (B) Ribosome-release timecourse for the natively unfolded protein PIR (circles). The chain release process was triggered by the addition of hydroxylamine, which cleaves the ester bond linking the ribosome-associated tRNA to the nascent chain’s C terminus. The observed rate constant for hydroxylamine-induced PIR departure from the ribosome, corrected for minor amounts of spontaneous chain release (see control data, squares) is 1.3 × 10⁻³ s−1. This rate constant shows that, for the selected experimental conditions, PIR ribosome release and any concurrent PIR conformational sampling take place on the hr timescale. The triangles denote the data for a fully ribosome–released hydroxylamine release reaction for one hour at 37°C.

Similar articles

Cited by

References

    1. Englander SW, Mayne L, Krishna MMG. Protein folding and misfolding: mechanism and principles. Q Rev Biophys. 2007;40:287–326. - PMC - PubMed
    1. Radford SE. Protein folding: progress made and promises ahead. Trends Biochem Sci. 2000;25:611–618. - PubMed
    1. Ellis RJ. The “bio” in biochemistry: Protein folding inside and outside the cell. Science. 1996;272:1448–1449. - PubMed
    1. Evans MS, Clark TF, Clark PL. Conformations of co-translational folding intermediates. Protein Pept Lett. 2005;12:189–195. - PubMed
    1. Bartlett AI, Radford SE. An expanding arsenal of experimental methods yields an explosion of insights into protein folding mechanisms. Nat Struct Mol Biol. 2009;16:582–588. - PubMed

Publication types

MeSH terms

Substances

LinkOut - more resources