

Role of histidine 932 of the human mitochondrial DNA polymerase in nucleotide discrimination and inherited disease
- PMID: 20685647
- PMCID: PMC2962517
- DOI: 10.1074/jbc.M110.156182
Role of histidine 932 of the human mitochondrial DNA polymerase in nucleotide discrimination and inherited disease
Abstract
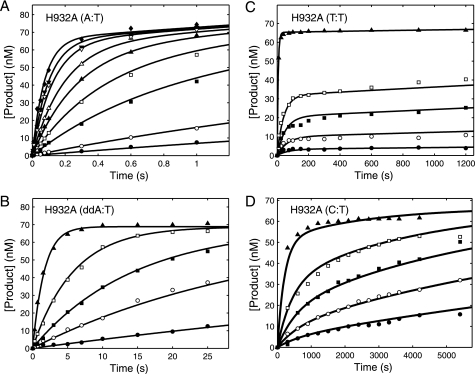
The human mitochondrial DNA polymerase (pol γ) is nuclearly encoded and is solely responsible for the replication and repair of the mitochondrial genome. The progressive accumulation of mutations within the mitochondrial genome is thought to be related to aging, and mutations in the pol γ gene are responsible for numerous heritable disorders including progressive external opthalmoplegia, Alpers syndrome, and parkinsonism. Here we investigate the kinetic effect of H932Y, a mutation associated with opthalmoplegia. Mutations H932Y and H932A reduce the specificity constant governing correct nucleotide incorporation 150- and 70-fold, respectively, without significantly affecting fidelity of incorporation or the maximum rate of incorporation. However, this leads to only a 2-fold reduction in rate of incorporation at a physiological nucleotide concentration (∼100 μm). Surprisingly, incorporation of T:T or C:T mismatches catalyzed by either H932Y or H932A mutants was followed by slow pyrophosphate release (or fast pyrophosphate rebinding). Also, H932Y readily catalyzed incorporation of multiple mismatches, which may have a profound physiological impact over time. His-932 is thought to contact the β-phosphate of the incoming nucleotide, so it is perhaps surprising that H932Y appears to slow rather than accelerate pyrophosphate release.
Figures

Similar articles
-
Fidelity of the human mitochondrial DNA polymerase.J Biol Chem. 2006 Nov 24;281(47):36236-40. doi: 10.1074/jbc.M607964200. Epub 2006 Sep 27. J Biol Chem. 2006. PMID: 17005554
-
Incorporation and replication of 8-oxo-deoxyguanosine by the human mitochondrial DNA polymerase.J Biol Chem. 2006 Nov 24;281(47):36241-8. doi: 10.1074/jbc.M607965200. Epub 2006 Sep 27. J Biol Chem. 2006. PMID: 17005553
-
Fidelity of Dpo4: effect of metal ions, nucleotide selection and pyrophosphorolysis.EMBO J. 2005 Sep 7;24(17):2957-67. doi: 10.1038/sj.emboj.7600786. Epub 2005 Aug 18. EMBO J. 2005. PMID: 16107880 Free PMC article.
-
DNA polymerase gamma, the mitochondrial replicase.Annu Rev Biochem. 2004;73:293-320. doi: 10.1146/annurev.biochem.72.121801.161455. Annu Rev Biochem. 2004. PMID: 15189144 Review.
-
Mutations in DNA polymerase gamma cause error prone DNA synthesis in human mitochondrial disorders.Acta Biochim Pol. 2003;50(1):155-67. Acta Biochim Pol. 2003. PMID: 12673356 Review.
Cited by
-
Alpers disease mutations in human DNA polymerase gamma cause catalytic defects in mitochondrial DNA replication by distinct mechanisms.Front Genet. 2015 Apr 9;6:135. doi: 10.3389/fgene.2015.00135. eCollection 2015. Front Genet. 2015. PMID: 25914719 Free PMC article.
-
Mutations in human DNA polymerase γ confer unique mechanisms of catalytic deficiency that mirror the disease severity in mitochondrial disorder patients.Hum Mol Genet. 2013 Mar 15;22(6):1074-85. doi: 10.1093/hmg/dds509. Epub 2012 Dec 3. Hum Mol Genet. 2013. PMID: 23208208 Free PMC article.
-
Mapping 136 pathogenic mutations into functional modules in human DNA polymerase γ establishes predictive genotype-phenotype correlations for the complete spectrum of POLG syndromes.Biochim Biophys Acta. 2014 Jul;1837(7):1113-21. doi: 10.1016/j.bbabio.2014.01.021. Epub 2014 Feb 7. Biochim Biophys Acta. 2014. PMID: 24508722 Free PMC article.
-
POLG1-related and other "mitochondrial Parkinsonisms": an overview.J Mol Neurosci. 2011 May;44(1):17-24. doi: 10.1007/s12031-010-9488-9. Epub 2011 Jan 8. J Mol Neurosci. 2011. PMID: 21221844 Review.
-
Signatures of Nucleotide Analog Incorporation by an RNA-Dependent RNA Polymerase Revealed Using High-Throughput Magnetic Tweezers.Cell Rep. 2017 Oct 24;21(4):1063-1076. doi: 10.1016/j.celrep.2017.10.005. Cell Rep. 2017. PMID: 29069588 Free PMC article.
References
-
- Suomalainen A., Majander A., Wallin M., Setälä K., Kontula K., Leinonen H., Salmi T., Paetau A., Haltia M., Valanne L., Lonnqvist J., Peltonen L., Somer H. (1997) Neurology 48, 1244–1253 - PubMed
-
- Steitz T. A., Smerdon S., Jäger J., Wang J., Kohlstaedt L. A., Friedman J. M., Beese L. S., Rice P. A. (1993) Cold Spring Harb. Symp. Quant. Biol. 58, 495–504 - PubMed
-
- Doublié S., Tabor S., Long A. M., Richardson C. C., Ellenberger T. (1998) Nature 391, 251–258 - PubMed
Publication types
MeSH terms
Substances
Grants and funding
LinkOut - more resources
Full Text Sources
