

SIRT4 regulates fatty acid oxidation and mitochondrial gene expression in liver and muscle cells
- PMID: 20685656
- PMCID: PMC2952200
- DOI: 10.1074/jbc.M110.124164
SIRT4 regulates fatty acid oxidation and mitochondrial gene expression in liver and muscle cells
Abstract
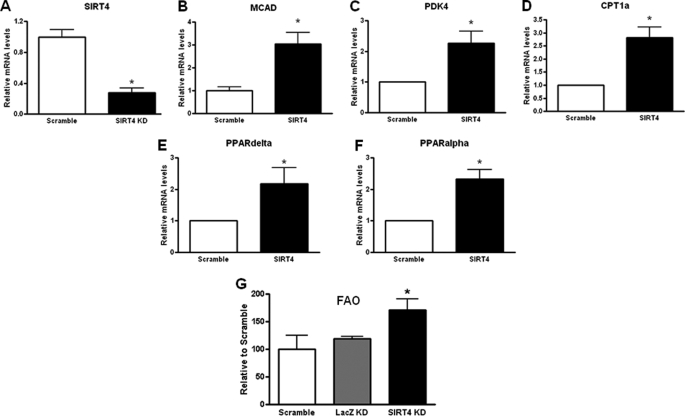
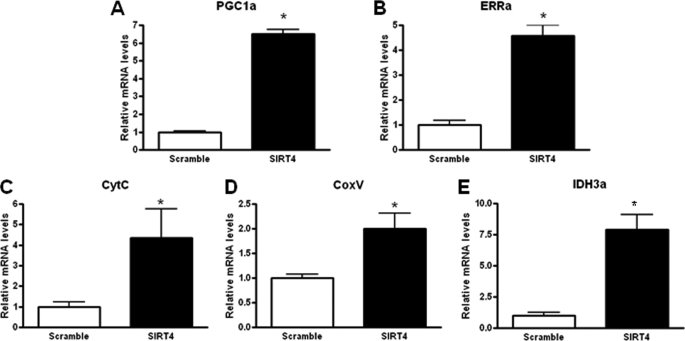
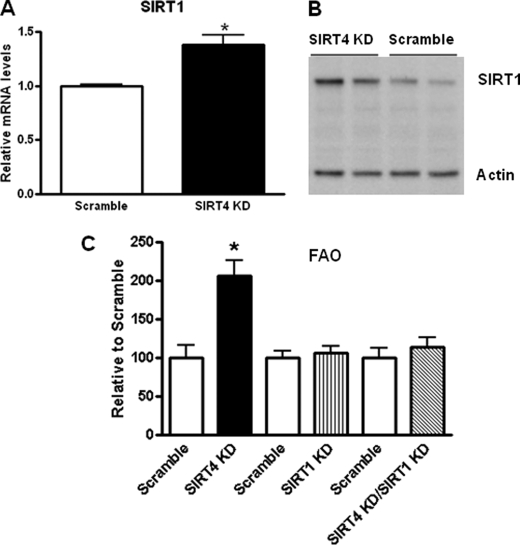
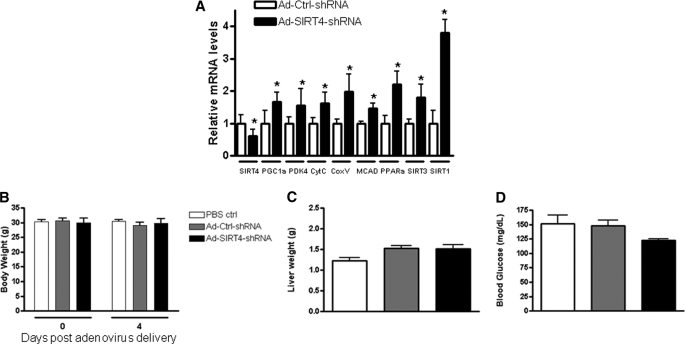
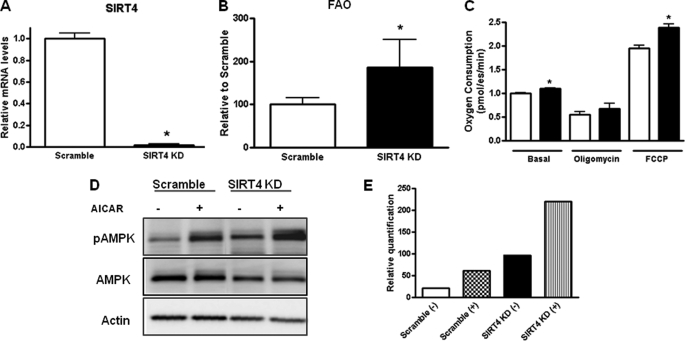
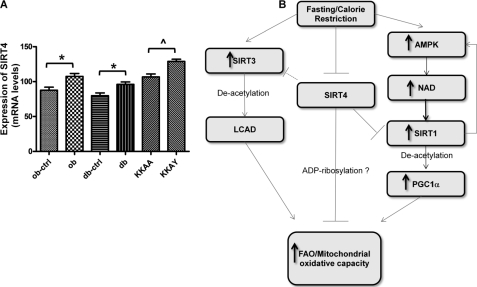
SIRT4, a member of the sirtuin family, has been implicated in the regulation of insulin secretion by modulation of glutamate dehydrogenase. However, the role of this enzyme in the regulation of metabolism in other tissues is unknown. In this study we investigated whether depletion of SIRT4 would enhance liver and muscle metabolic functions. To do this SIRT4 was knocked down using an adenoviral shRNA in mouse primary hepatocytes and myotubes. We observed a significant increase in gene expression of mitochondrial and fatty acid metabolism enzymes in hepatocytes with reduced SIRT4 levels. SIRT4 knockdown also increased SIRT1 mRNA and protein levels both in vitro and in vivo. In agreement with the increased fatty acid oxidation (FAO) gene expression, we showed a significant increase in FAO in SIRT4 knockdown primary hepatocytes compared with control, and this effect was dependent on SIRT1. In primary myotubes, knockdown of SIRT4 resulted in increased FAO, cellular respiration, and pAMPK levels. When SIRT4 was knocked down in vivo by tail vein injection of a shRNA adenovirus, we observed a significant increase in hepatic mitochondrial and FAO gene expression consistent with the findings in primary hepatocytes. Taken together these findings demonstrate that SIRT4 inhibition increases fat oxidative capacity in liver and mitochondrial function in muscle, which might provide therapeutic benefits for diseases associated with ectopic lipid storage such as type 2 diabetes.
Figures
Similar articles
-
SIRT4 represses peroxisome proliferator-activated receptor α activity to suppress hepatic fat oxidation.Mol Cell Biol. 2013 Nov;33(22):4552-61. doi: 10.1128/MCB.00087-13. Epub 2013 Sep 16. Mol Cell Biol. 2013. PMID: 24043310 Free PMC article.
-
SIRT4 is a regulator of human skeletal muscle fatty acid metabolism influencing inner and outer mitochondrial membrane-mediated fusion.Cell Signal. 2023 Dec;112:110931. doi: 10.1016/j.cellsig.2023.110931. Epub 2023 Oct 17. Cell Signal. 2023. PMID: 37858614
-
Acetylation of Mitochondrial Trifunctional Protein α-Subunit Enhances Its Stability To Promote Fatty Acid Oxidation and Is Decreased in Nonalcoholic Fatty Liver Disease.Mol Cell Biol. 2016 Sep 26;36(20):2553-67. doi: 10.1128/MCB.00227-16. Print 2016 Oct 15. Mol Cell Biol. 2016. PMID: 27457618 Free PMC article.
-
Mitochondrial Function, Metabolic Regulation, and Human Disease Viewed through the Prism of Sirtuin 4 (SIRT4) Functions.J Proteome Res. 2019 May 3;18(5):1929-1938. doi: 10.1021/acs.jproteome.9b00086. Epub 2019 Apr 8. J Proteome Res. 2019. PMID: 30913880 Free PMC article. Review.
-
The Roles of Mitochondrial SIRT4 in Cellular Metabolism.Front Endocrinol (Lausanne). 2019 Jan 7;9:783. doi: 10.3389/fendo.2018.00783. eCollection 2018. Front Endocrinol (Lausanne). 2019. PMID: 30666234 Free PMC article. Review.
Cited by
-
Screening of Biomarkers in Liver Tissue after Bariatric Surgery Based on WGCNA and SVM-RFE Algorithms.Dis Markers. 2023 Jan 30;2023:2970429. doi: 10.1155/2023/2970429. eCollection 2023. Dis Markers. 2023. PMID: 36755803 Free PMC article.
-
Sirtuin-4 (SIRT4), a therapeutic target with oncogenic and tumor-suppressive activity in cancer.Onco Targets Ther. 2018 Jun 11;11:3395-3400. doi: 10.2147/OTT.S157724. eCollection 2018. Onco Targets Ther. 2018. PMID: 29928130 Free PMC article. Review.
-
Modulatory effect of resveratrol on SIRT1, SIRT3, SIRT4, PGC1α and NAMPT gene expression profiles in wild-type adult zebrafish liver.Mol Biol Rep. 2012 Mar;39(3):3281-9. doi: 10.1007/s11033-011-1096-4. Epub 2011 Jun 25. Mol Biol Rep. 2012. PMID: 21706162
-
Co-expression Analysis of Sirtuins and Related Metabolic Biomarkers in Juveniles of Gilthead Sea Bream (Sparus aurata) With Differences in Growth Performance.Front Physiol. 2018 Jun 5;9:608. doi: 10.3389/fphys.2018.00608. eCollection 2018. Front Physiol. 2018. PMID: 29922168 Free PMC article.
-
Unlocking the Nexus of Sirtuins: A Comprehensive Review of Their Role in Skeletal Muscle Metabolism, Development, and Disorders.Int J Biol Sci. 2024 Jun 3;20(8):3219-3235. doi: 10.7150/ijbs.96885. eCollection 2024. Int J Biol Sci. 2024. PMID: 38904020 Free PMC article. Review.
References
-
- Guarente L. (2007) Cold Spring Harb. Symp. Quant. Biol. 72, 483–488 - PubMed
-
- Frye R. A. (1999) Biochem. Biophys. Res. Commun. 260, 273–279 - PubMed
-
- Haigis M. C., Mostoslavsky R., Haigis K. M., Fahie K., Christodoulou D. C., Murphy A. J., Valenzuela D. M., Yancopoulos G. D., Karow M., Blander G., Wolberger C., Prolla T. A., Weindruch R., Alt F. W., Guarente L. (2006) Cell 126, 941–954 - PubMed
MeSH terms
Substances
LinkOut - more resources
Full Text Sources
Other Literature Sources
Molecular Biology Databases
