A moment invariant for evaluating the chirality of three-dimensional objects
- PMID: 20685692
- PMCID: PMC3024826
- DOI: 10.1098/rsif.2010.0297
A moment invariant for evaluating the chirality of three-dimensional objects
Abstract
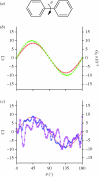
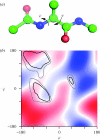
Chirality is an important feature of three-dimensional objects and a key concept in chemistry, biology and many other disciplines. However, it has been difficult to quantify, largely owing to computational complications. Here we present a general chirality measure, called the chiral invariant (CI), which is applicable to any three-dimensional object containing a large amount of data. The CI distinguishes the hand of the object and quantifies the degree of its handedness. It is invariant to the translation, rotation and scale of the object, and tolerant to a modest amount of noise in the experimental data. The invariant is expressed in terms of moments and can be computed in almost no time. Because of its universality and computational efficiency, the CI is suitable for a wide range of pattern-recognition problems. We demonstrate its applicability to molecular atomic models and their electron density maps. We show that the occurrence of the conformations of the macromolecular polypeptide backbone is related to the value of the CI of the constituting peptide fragments. We also illustrate how the CI can be used to assess the quality of a crystallographic electron density map.
Figures


Similar articles
-
Chirality of 4,4'-Biphenylene Bridged Polybissilsesquioxane Nanotubes Using the Dipeptides Derived from Valine.J Nanosci Nanotechnol. 2015 Mar;15(3):2451-5. doi: 10.1166/jnn.2015.9492. J Nanosci Nanotechnol. 2015. PMID: 26413686
-
Terminal is important for the helicity of the self-assemblies of dipeptides derived from alanine.Langmuir. 2013 May 21;29(20):6013-7. doi: 10.1021/la400910g. Epub 2013 May 7. Langmuir. 2013. PMID: 23617232
-
Solvent-induced handedness inversion of dipeptide sodium salts derived from alanine.Langmuir. 2013 Aug 6;29(31):9721-6. doi: 10.1021/la402174w. Epub 2013 Jul 25. Langmuir. 2013. PMID: 23915244
-
Recognition and ordering at surfaces: the importance of handedness and footedness.Chemphyschem. 2011 Jun 6;12(8):1474-80. doi: 10.1002/cphc.201001034. Epub 2011 Apr 27. Chemphyschem. 2011. PMID: 21523877 Review.
-
Molecular recognition properties of tartrates and metal-tartrates in solution and gas phase.J Sep Sci. 2009 May;32(10):1537-47. doi: 10.1002/jssc.200900064. J Sep Sci. 2009. PMID: 19391178 Review.
Cited by
-
Uncovering new families and folds in the natural protein universe.Nature. 2023 Oct;622(7983):646-653. doi: 10.1038/s41586-023-06622-3. Epub 2023 Sep 13. Nature. 2023. PMID: 37704037 Free PMC article.
-
Recognizing and validating ligands with CheckMyBlob.Nucleic Acids Res. 2021 Jul 2;49(W1):W86-W92. doi: 10.1093/nar/gkab296. Nucleic Acids Res. 2021. PMID: 33905501 Free PMC article.
-
Automatic recognition of ligands in electron density by machine learning.Bioinformatics. 2019 Feb 1;35(3):452-461. doi: 10.1093/bioinformatics/bty626. Bioinformatics. 2019. PMID: 30016407 Free PMC article.
-
Automated identification of crystallographic ligands using sparse-density representations.Acta Crystallogr D Biol Crystallogr. 2014 Jul;70(Pt 7):1844-53. doi: 10.1107/S1399004714008578. Epub 2014 Jun 29. Acta Crystallogr D Biol Crystallogr. 2014. PMID: 25004962 Free PMC article.
References
-
- Ruch E. 1977. Chiral derivatives of achiral molecules: standard classes and the problem of a right–left classification. Angew. Chem. Int. Ed. Engl. 16, 65–7210.1002/anie.197700653 (doi:10.1002/anie.197700653) - DOI - DOI
-
- Schulgasser K., Witztum A. 2004. Spiralling upward. J. Theor. Biol. 230, 275–28010.1016/j.jtbi.2004.05.018 (doi:10.1016/j.jtbi.2004.05.018) - DOI - DOI - PubMed
-
- Schulgasser K., Witztum A. 2004. The hierarchy of chirality. J. Theor. Biol. 230, 281–28810.1016/j.jtbi.2004.05.012 (doi:10.1016/j.jtbi.2004.05.012) - DOI - DOI - PubMed
-
- Wolosker H., Blackshaw S., Snyder S. H. 1999. Serine racemase: a glial enzyme synthesizing d-serine to regulate glutamate-N-methyl-d-aspartate neurotransmission. Proc. Natl Acad. Sci. USA 96, 13 409–13 41410.1073/pnas.96.23.13409 (doi:10.1073/pnas.96.23.13409) - DOI - DOI - PMC - PubMed
-
- Laska M., Liesen A., Teubner P. 1999. Enantioselectivity of odor perception in squirrel monkeys and humans. Am. J. Physiol. Regul. Integr. Comp. Physiol. 277, R1098–R1103 - PubMed
Publication types
MeSH terms
Substances
LinkOut - more resources
Full Text Sources

