

Rapid evolution of cold tolerance in stickleback
- PMID: 20685715
- PMCID: PMC3013383
- DOI: 10.1098/rspb.2010.0923
Rapid evolution of cold tolerance in stickleback
Abstract
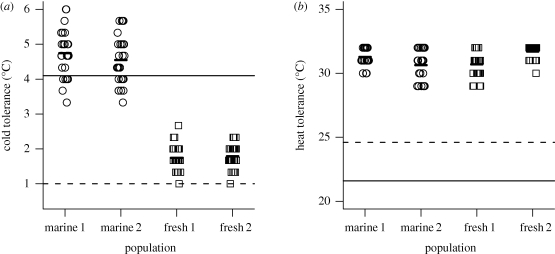
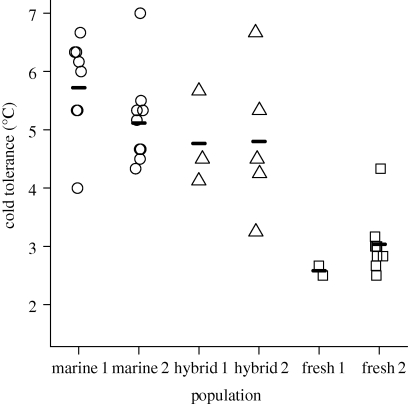
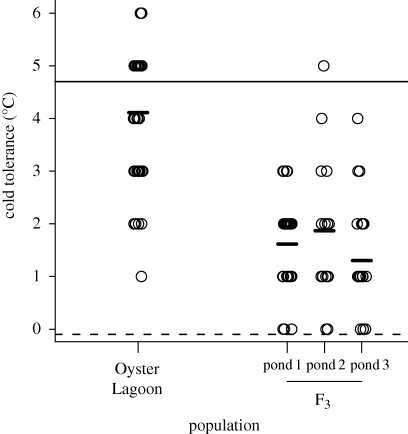
Climate change is predicted to lead to increased average temperatures and greater intensity and frequency of high and low temperature extremes, but the evolutionary consequences for biological communities are not well understood. Studies of adaptive evolution of temperature tolerance have typically involved correlative analyses of natural populations or artificial selection experiments in the laboratory. Field experiments are required to provide estimates of the timing and strength of natural selection, enhance understanding of the genetics of adaptation and yield insights into the mechanisms driving evolutionary change. Here, we report the experimental evolution of cold tolerance in natural populations of threespine stickleback fish (Gasterosteus aculeatus). We show that freshwater sticklebacks are able to tolerate lower minimum temperatures than marine sticklebacks and that this difference is heritable. We transplanted marine sticklebacks to freshwater ponds and measured the rate of evolution after three generations in this environment. Cold tolerance evolved at a rate of 0.63 haldanes to a value 2.5°C lower than that of the ancestral population, matching values found in wild freshwater populations. Our results suggest that cold tolerance is under strong selection and that marine sticklebacks carry sufficient genetic variation to adapt to changes in temperature over remarkably short time scales.
Figures
References
-
- Crowley T. J., North G. R. 1988. Abrupt climate change and extinction events in earth history. Science 240, 996–100210.1126/science.240.4855.996 (doi:10.1126/science.240.4855.996) - DOI - DOI - PubMed
-
- Deutsch C., Tewksbury J., Huey R., Sheldon K., Ghalambor C., Haak D., Martin P. 2008. Impacts of climate warming on terrestrial ectotherms across latitude. Proc. Natl Acad. Sci. USA 105, 6668–667210.1073/pnas.0709472105 (doi:10.1073/pnas.0709472105) - DOI - DOI - PMC - PubMed
-
- Hoffmann A. A., Hallas R. J., Dean J. A., Schiffer M. 2003. Low potential for climatic stress adaptation in a rainforest Drosophila species. Science 301, 100–10210.1126/science.1084296 (doi:10.1126/science.1084296) - DOI - DOI - PubMed
-
- Huey R. B., Deutsch C. A., Tewksbury J. J., Vitt L. J., Hertz P. E. 2009. Why tropical lizards are vulnerable to climate warming. Proc. R. Soc. B 276, 1939–194810.1098/rspb.2008.1957 (doi:10.1098/rspb.2008.1957) - DOI - DOI - PMC - PubMed
-
- Malcolm J. R., Liu C., Neilson R. P., Hansen L. 2006. Global warming and extinctions of endemic species from biodiversity hotspots. Conserv. Biol. 20, 538–54810.1111/j.1523-1739.2006.00364.x (doi:10.1111/j.1523-1739.2006.00364.x) - DOI - DOI - PubMed
Publication types
MeSH terms
LinkOut - more resources
Full Text Sources
