. 2010 Nov;299(5):F1048-55.
doi: 10.1152/ajprenal.00691.2009. Epub 2010 Aug 4.

Rapid diagnosis and quantification of acute kidney injury using fluorescent ratio-metric determination of glomerular filtration rate in the rat

Affiliations

Rapid diagnosis and quantification of acute kidney injury using fluorescent ratio-metric determination of glomerular filtration rate in the rat

Exing Wang et al. Am J Physiol Renal Physiol. 2010 Nov.

Abstract

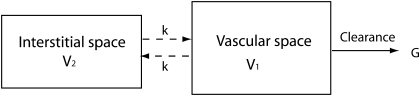
The rapid diagnosis and quantification of acute kidney injury (AKI) severity remain high clinical priorities. By combining intravital fluorescent ratiometric two-photon kidney imaging and the two-compartment pharmacokinetics model, we demonstrate that rapid quantification of glomerular filtration rate (GFR) can be achieved in physiologic and AKI rat kidney models. Using a bolus infusion of a mixture of FITC-inulin and a 500-kDa Texas Red dextran, a full spectrum of GFR values, ranging from 0.17 to 1.12 ml·min(-1)·100 g(-1), was obtained. The GFR values thus determined correlated well with values obtained by the standard 2-h inulin infusion clearance method with a Pearson's correlation coefficient of 0.85. In addition, postischemia deterioration was studied by measuring GFR using the two-photon approach during 24 h following a 45-min bilateral ischemia clamp model. The GFR was found to decline sharply during the initial 4 h followed by a nadir with little sign of rising over the ensuing 24-h period. Moreover, a FITC-labeled 5-kDa dextran was identified as having nearly identical filtration characteristics as FITC-inulin, but had markedly increased fluorescent intensity, thus minimizing the quantity needed for individual studies. The technique reported allows for very rapid GFR determinations, within 10-15 min, based on plasma clearance of a freely filtered fluorescence probe, instead of a prolonged one-compartment interstitial space reporter molecule clearance employed by other technologies.


Figures

Fig. 1.
Fig. 1.
Two-compartment model.
Fig. 2.
Fig. 2.
Two-photon images from a living rat infused a mixture of 500-kDa Texas Red-dextran (red; AD) and FITC-inulin (green; EH). The overall intensity in the capillaries (CAP) was relatively stable for the red channel, but it decreased drastically for the green channel indicating the loss of labeled inulin from the vascular space. Plasma regions in the capillaries were stained by the probes. The dark objects in the capillaries are red blood cells (RBC) as they exclude staining. FITC-inulin was cleared by the kidney rapidly as it strongly stained the proximal tubule (PT) lumen 80 s after the infusion. Postinfusion times were shown in the bottom panels.
Fig. 3.
Fig. 3.
Comparison of 1- and 2-compartment models. Data of fluorescence ratio of FITC-inulin/500-kDa Texas Red-dextran (●) from 2-photon images of a rat under physiologic conditions (left) and from an ischemic model (right) were fitted to 1-compartment (dotted line) and 2-compartment (solid line) models (A and B). The 1-compartment model only fits the initial time points well, but the 2-compartment model fits well to the entire data points for both animal models. The same 2 experimental data sets shown in the top row were replotted with separated fast (solid line) and slow (dotted line) exponentials (bottom row) in C and D, respectively. For clarity purpose, the fast exponential curves have been shifted up. The fast exponential seen on both panels were similar indicating a similar intercompartment movement of FITC-inulin on both animals, but the difference on the slow exponential between the rats was substantial. A more rapid decay seen with the rat under physiologic conditions indicates that this animal had a higher glomerular filtration rate (GFR) than the ischemic rat.
Fig. 4.
Fig. 4.
Comparison between GFR1 and GFR2 and determination of minimal sampling time. GFR1 was obtained by fitting the time points from 300 s onward to a single exponential equation and using Eq. 8. GFR2 was obtained by fitting all data points to the 2-compartment model. The solid line was obtained by fitting the 2 sets of GFR values to a quadratic equation. At high values, GFR1 deviates from the diagonal line (dotted) on which the 2 sets of GFR would be identical (A). The correlation between GFR2 and GFR2b is shown in B. GFR2b was determined using a 15-min postinfusion internal. Pearson coefficients between GFR2 and the GFR obtained with reduced time intervals of 15, 10, and 7 min are also shown.
Fig. 5.
Fig. 5.
Correlation with the standard inulin clearance. The GFR values (ml·min−1·100 g−1) obtained by 2-photon microscopy from all 4 animal models are plotted against the values from the gold standard, the inulin clearance with continuous infusion. The Pearson coefficient is 0.85. The model under physiologic conditions (●) produced the highest GFR, whereas the ischemic model (▵) showed the lowest GFR. The other 2 models, gentamicin (▴)-treated and LPS (○)-treated, had GFR in the middle range.
Fig. 6.
Fig. 6.
Postischemia effect. The postischemia GFR values obtained using 2-photon microscopy are shown with the recovery time following a 45-min bilateral ischemia treatment.
Fig. 7.
Fig. 7.
Comparison of FITC-inulin and 5-kDa FITC-dextran. Data were collected on an Olympus FV 1000 home-built 2-photon system. Fluorescence intensity decay curves from the same rat that was first injected with 0.68 mg of 5k FITC dextran (●) followed by a second infusion with 3.3 mg of FITC inulin (○). The second infusion was given after all 5k FITC dextran from the first infusion had been completely cleared. Inset: result of single-photon fluorescence analysis conducted on the Molecular Device SpectraMaxM5. An identical concentration (1 μg/ml) was used for both 5K FITC-dextran and FITC-inuin. The excitation and emission wavelengths were 488 and 520 nm, respectively.

References

    1. Altman PL. Blood and other body fluids (ed. DS Dittmer) 1961. Federation of American Societies for Experimental Biology, Washington, DC
    1. Brandstrom E, Grzegorczyk A, Jacobsson L, Friberg P, Lindahl A, Aurell M. GFR measurement with iohexol and 51Cr-EDTA. A comparison of the two favoured GFR markers in Europe Nephrology Dialysis. Transplantation 13: 1176–1182, 1998. - PubMed
    1. Dunn KW, Sandoval RM, Kelly KJ, Dagher PC, Tanner GA, Atkinson SJ, Bacallao RL, Molitoris BA. Functional studies of the kidney of living animals using multicolor two-photon microscopy. Am J Physiol Cell Physiol 283: C905–C916, 2002 - PubMed
    1. Erley CM, Bader BD, Berger ED, Vochazer A, Jorzik JJ, Dietz K, Risler T. Plasma clearance of iodine contrast media as a measure of glomerular filtration rate in critically ill patients. Crit Care Med 29: 1544–1550, 2001 - PubMed
    1. Hackstein N, Bauer J, Hauck EW, Ludwig M, Kramer HJ, Rau WS. Measuring single-kidney glomerular filtration rate on single-detector helical CT using a two-point Patlak plot technique in patients with increased interstitial space. AJR Am J Roentgenol 181: 147–156, 2003 - PubMed

Publication types

MeSH terms