. 2010 Oct;24(10):1917-34.
doi: 10.1210/me.2010-0201. Epub 2010 Aug 4.

The cooperative function of nuclear receptor coactivator 1 (NCOA1) and NCOA3 in placental development and embryo survival

Affiliations

The cooperative function of nuclear receptor coactivator 1 (NCOA1) and NCOA3 in placental development and embryo survival

Xian Chen et al. Mol Endocrinol. 2010 Oct.

Abstract

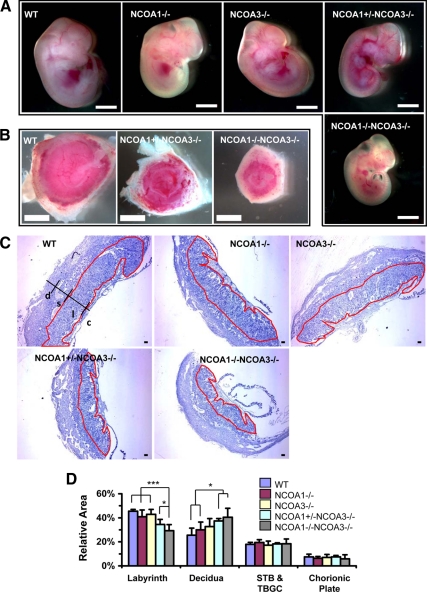
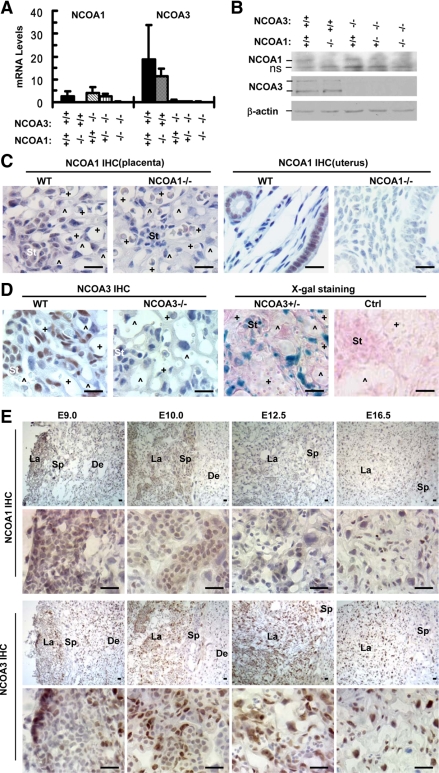
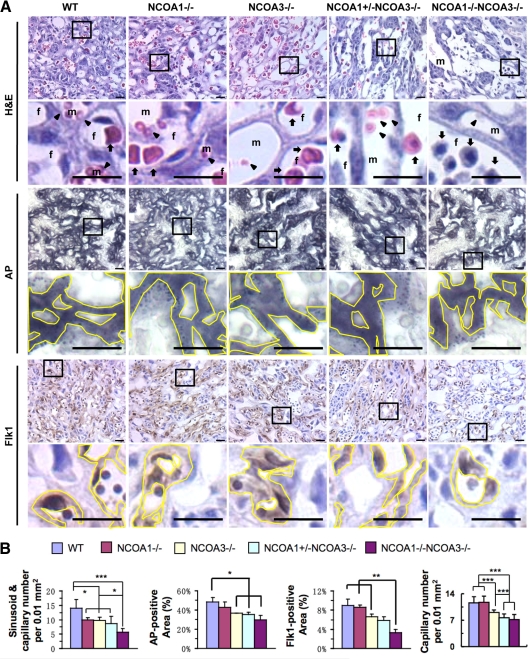
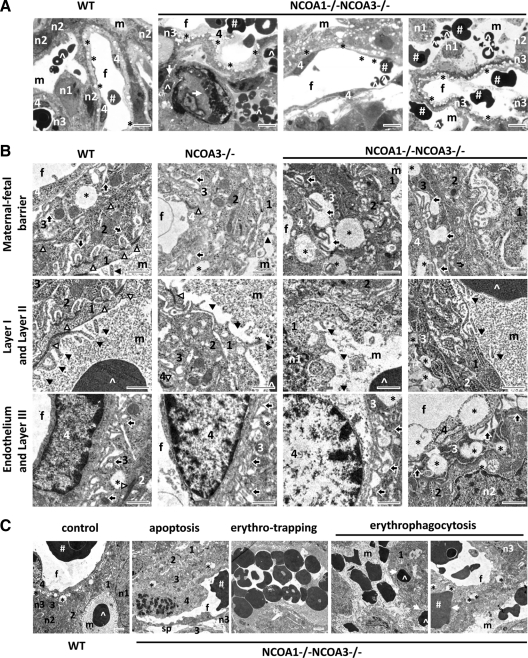
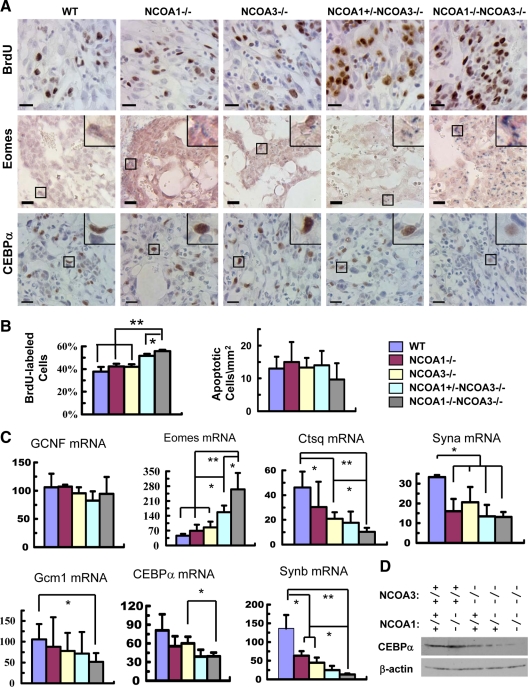
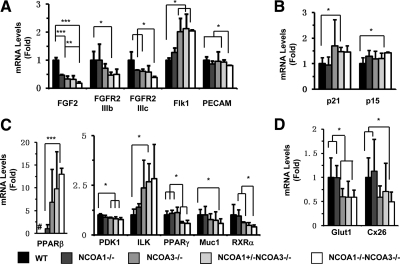
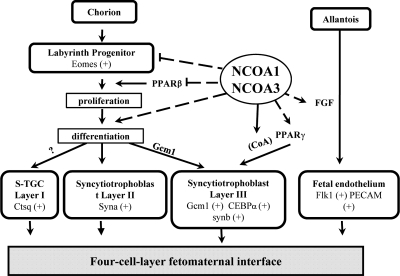
Nuclear receptor coactivator 1 [NCOA1/steroid receptor coactivator (SRC)-1] and NCOA3 (SRC-3/AIB1/ACTR) constitute two thirds of the SRC (steroid receptor coactivator) family. Although in vitro experiments have suggested overlapping functions between NCOA1 and NCOA3, their in vivo functional relationship is poorly understood. In this study, NCOA1 and NCOA3 double knockout mice were generated to determine the compensatory roles of NCOA1 and NCOA3 in development. NCOA1(-/-) mice survived normally, whereas most NCOA3(-/-) embryos were viable at embryonic d 13.5 (E13.5). In contrast, the majority of double-knockout (DKO) embryos died by E13.5. NCOA1 and NCOA3 are expressed in the labyrinth, and labyrinths of NCOA1(+/-);NCOA3(-/-) and DKO placentas were small compared with wild-type and single-knockout labyrinths. DKO labyrinths exhibited low densities of maternal blood sinuses and fetal capillaries and displayed fetomaternal blood transfusion. At the interface between maternal and fetal circulations, layer I sinusoidal trophoblast giant cells showed a reduced density of microvilli. Layer III syncytiotrophoblasts appeared to accumulate large lipid droplets and have reduced density and deepened invaginations of the intrasyncytial bays. The endothelial layer in DKO labyrinth showed abnormal morphologies and had large lipid droplets. Furthermore, disruption of NCOA1 and NCOA3 increased labyrinth trophoblast proliferation and their progenitor gene expression but decreased their differentiation gene expression. NCOA1 and NCOA3 deficiencies also affected the expression of several genes for placental morphogenesis including TGFβ-, peroxisome proliferator-activated receptor-β-, and peroxisome proliferator-activated receptor-γ-regulated genes and for glucose transportation including GLUT1 and Cx26. These findings demonstrate that NCOA1 and NCOA3 cooperatively regulate placental morphogenesis and embryo survival.


Figures

Figure 1
Figure 1
Disruption of NCOA1 and NCOA3 in mice restricted fetal and placental growth. A, E12.5 mouse embryos with indicated genotypes. Scale bar, 2 mm. B, E12.5 mouse placentas with indicated genotypes. Scale bar, 2 mm. Panel C, H&E-stained middle sagittal sections of E12.5 mouse placentas. The labyrinth area in each panel is circulated by red line. c, chorionic plate; l, labyrinth; s, spongiotrophoblast; d, decidua. Scale bar, 100 μm. Panel D, The relative areas of placental components for the indicated genotype groups. For each of the middle sagittal section of placenta, the labyrinth area, deciduas area, STB and TBGC area, chorionic plate area, and total placental area were separately measured, after which the percentages of a specific area to total area was calculated. For each group four to eight placentas were measured. *, P < 0.05; ***, P < 0.001, compared by unpaired t test between any two groups. STB, Spongiotrophoblast; TBG, trophoblast giant cell.
Figure 2
Figure 2
The distribution patterns of NCOA1 and NCOA3 in the placenta. A, qPCR analysis of NCOA1 and NCOA3 mRNAs in E12.5 placentas with the indicated genotypes. RNA samples of two placentas were pooled, and three pools were assayed for each group. B, Western blot analysis of NCOA1 and NCOA3 proteins in E12.5 placentas with indicated genotypes. The weak NCOA1 bands and high background of the image were due to the low NCOA1 levels and elongated exposure time. β-Actin served as a loading control (Ctrl). The two NCOA3 bands were two NCOA3 splicing isoforms. ns, A non-specific band detected in all samples including NCOA1 null placentas. C, Detection of NCOA1 by IHC in the placental labyrinth of E12.5 WT embryos. The uterine sections of adult mice served as a positive control, whereas NCOA1−/− placental and uterine samples served as negative controls. D, Detection of NCOA3 expression by IHC and X-gal staining (blue) in E12.5 labyrinths with indicated genotypes. The sections were also counterstained with nuclear fast red. E, Detection of NCOA1 and NCOA3 by IHC using cryosections prepared from E9.0, E10.0, E12.5, and E16.5 placentas of WT embryos. Image annotations: St, stem-like trophoblast; +, fetal capillary; ^, maternal sinusoid; De, decidua; La, labyrinth; Sp, spongiotrophoblast; scale bars in panels C, D, and E, 20 μm.
Figure 3
Figure 3
Compound NCOA1 and NCOA3 mutations reduced maternal blood sinusoid and fetal vascular densities in the placental labyrinth. A, Histology and immunostaining of the labyrinth regions of E12.5 placentas with the indicated genotypes. Sections were stained by H&E, histochemically stained for AP activity (black), or immunostained by using an Flk1 antibody (brown) as indicated. The boxed areas were enlarged in the panels below. The immunostained slides were counterstained with hematoxylin. Arrows point at fetal erythrocytes. Arrowheads point at maternal erythrocytes. Yellow lines mark the AP-positive areas (black) or Flk1-positive areas (brown). f, fetal capillary; m, maternal sinusoid. Scale bar, 20 μm. B, Quantitative analyses of placental images shown in panel A. The density of sinusoids and capillaries in the labyrinth was measured by using the ImageTool software. The AP-positive area, Flk1-positive area, and total labyrinth area were measured by using the i-Solution software. The relative densities of sinusoids and capillaries and the relative AP-positive and Flk1-positive areas were normalized to the total labyrinth area. For each group, three to eight placentas were analyzed. *, P < 0.05; **, P < 0.01; ***, P < 0.001, compared by unpaired t test between any two groups.
Figure 4
Figure 4
Abnormal morphogenesis observed in the labyrinths of E12.5 DKO mouse embryos. A, Toluidine blue-stained semithin sections of placental labyrinths from E12.5 embryos with the indicated genotypes. B, Subcellular ultrastructures of placental labyrinths from E12.5 embryos with the indicated genotypes. C, Several abnormalities observed in DKO labyrinths at E12.5. The image of a WT sample served as a control. Image annotations: 1, layer I mononuclear trophoblast; 2, layer II syncytiotrophoblast; 3, layer III syncytiotrophoblast; 4, fetal endothelial layer; #, fetal erythrocytes; f, fetal vessels; ^, maternal erythrocytes; m, maternal blood sinusoids; solid arrowhead, microvilli; n1, the nucleus of layer I trophoblast; n2, the nucleus of layer II trophoblast; n3, the nucleus of layer III trophoblast; open arrow, erythrophagocytosis; open arrowhead, tight cell-cell junction; solid arrow, intrasyncytial bay; *, lipid droplet; sp, big empty space between layer III trophoblasts and the endothelial layer of fetal capillaries; scale bars in panel A, 8 μm; scale bars in panel B, 1 μm; scale bars in panel C, 2 μm.
Figure 5
Figure 5
Compound knockout of NCOA1 and NCOA3 increased proliferation and decreased differentiation of the labyrinth trophoblasts at E12.5. A, Detection of the BrdU-labeled proliferative cells (brown) by IHC (upper panels), the stem-like trophoblasts by in situ hybridization of Eomes mRNA (blue) (middle panels), and the CEBPα protein (brown) in layer III trophoblasts by IHC (lower panels) in the labyrinth layer of E12.5 placentas with the indicated genotypes. The insets at upper right corners are amplified images of the boxed areas. Scale bars, 20 μm. B, The percentage of BrdU-labeled labyrinth trophoblasts in total labyrinth trophoblasts (left panel) and the number of apoptotic cells per mm2 area of labyrinth with indicated genotypes. Apoptotic cells were detected by TUNEL assay. The cell numbers of three samples for each group were counted by using the ImageTool software. C, Relative mRNA levels of several labyrinth trophoblast marker genes assayed by qPCR. *, P < 0.05; and **, P < 0.01, compared by t test between any two groups (n = 3 for each group). D, Western blot analysis of CEBPα in E12.5 placentas of mouse embryos with the indicated genotypes. β-Actin served as a loading control. GCNF, Germ cell nuclear factor.
Figure 6
Figure 6
Relative mRNA expression levels of genes affected by NCOA1 and/or NCOA3 deficiencies in the placenta at E12.5. A, Genes that regulate angiogenesis. B, TGFβ-responsive genes important for endothelial differentiation. C, Nuclear receptors and their target genes in the placenta. D, Genes important for glucose transportation. Notes: the # in the left part of panel C indicates that the PPARβ mRNA was undetectable in WT placenta; therefore, the relative expression level of PPARβ mRNA in NCOA1−/− placenta was set to 1 unit. The relative expression levels of all other genes in WT placenta were set to 1 unit. *, **, and ***, P < 0.05, P < 0.01, and P < 0.001 by unpaired t test between any two groups (n = 3 for each group).
Figure 7
Figure 7
A working model for NCOA1 and NCOA3 functions in labyrinth morphogenesis. Arrows indicate downstream developmental events or positive regulatory effects. Dashed lines indicate regulatory events without clear molecular mechanisms at this time. The question mark indicates that the cell lineage origin of S-TGC is contentious. Eomes is a marker gene of the labyrinth progenitors. Ctsq is a marker gene of Layer I sinusoidal trophoblast giant cells (S-TGC). Syna is a marker gene of Layer II syncytiotrophoblasts. Gcm1, CEBPα, and Synb are marker genes of Layer III syncytiotrophoblasts. Flk1 and PECAM are markers of endothelia. CoA, indicates that NCOA1 and NCOA3 are coactivators of PPARγ.

References

    1. Xu J, Li Q 2003 Review of the in vivo functions of the p160 steroid receptor coactivator family. Mol Endocrinol 17:1681–1692 - PubMed
    1. Xu J, Wu RC, O'Malley BW 2009 Normal and cancer-related functions of the p160 steroid receptor co-activator (SRC) family. Nat Rev Cancer 9:615–630 - PMC - PubMed
    1. Oñate SA, Tsai SY, Tsai MJ, O'Malley BW 1995 Sequence and characterization of a coactivator for the steroid hormone receptor superfamily. Science 270:1354–1357 - PubMed
    1. Anzick SL, Kononen J, Walker RL, Azorsa DO, Tanner MM, Guan XY, Sauter G, Kallioniemi OP, Trent JM, Meltzer PS 1997 AIB1, a steroid receptor coactivator amplified in breast and ovarian cancer. Science 277:965–968 - PubMed
    1. Louie MC, Zou JX, Rabinovich A, Chen HW 2004 ACTR/AIB1 functions as an E2F1 coactivator to promote breast cancer cell proliferation and antiestrogen resistance. Mol Cell Biol 24:5157–5171 - PMC - PubMed

Publication types

Substances