

Research resource: genome-wide profiling of methylated promoters in endometriosis reveals a subtelomeric location of hypermethylation
- PMID: 20685852
- PMCID: PMC5417403
- DOI: 10.1210/me.2010-0160
Research resource: genome-wide profiling of methylated promoters in endometriosis reveals a subtelomeric location of hypermethylation
Abstract
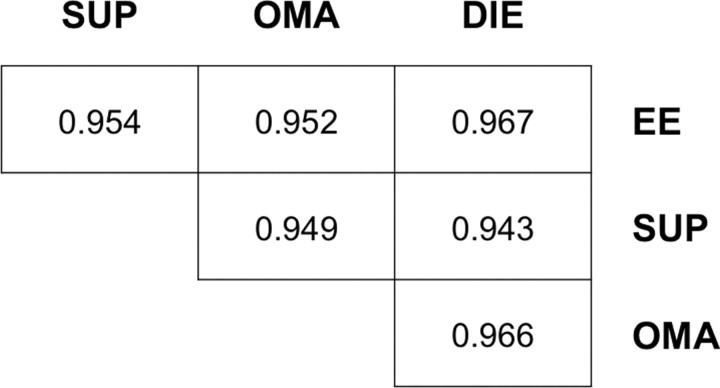
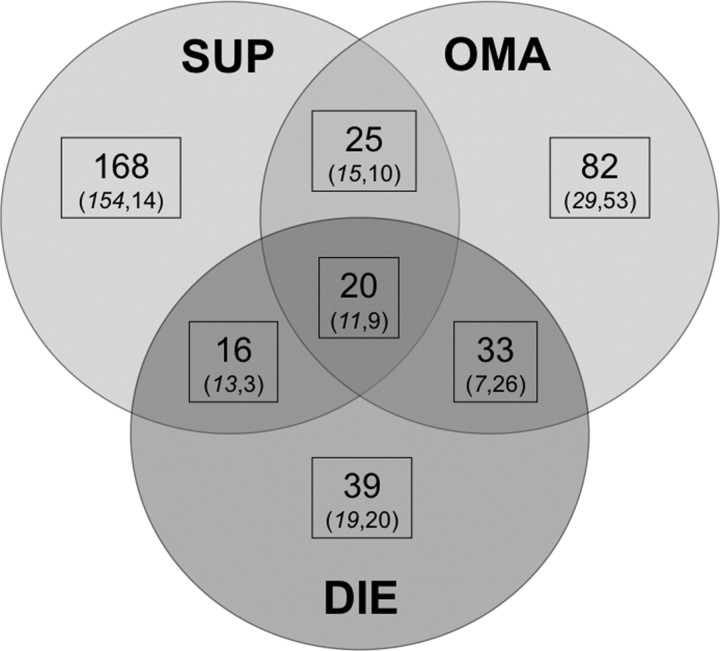
Several lines of evidence indicate that endometriosis could be partially due to selective epigenetic deregulations. Promoter hypermethylation of some key genes, such as progesterone receptor and aromatase, has been associated with the silencing of these genes and might contribute to the disease. However, it is unknown whether global alterations in DNA methylation patterns occur in endometriosis and to what extent they are involved in its pathogenesis. We conducted a whole-genome scanning of methylation status in more than 25,000 promoters, using methylated DNA immunoprecipitation with hybridization to promoter microarrays. We detailed the methylation profiles for each subtype of the disease (superficial endometriosis, endometriomas, and deep infiltrating endometriosis) and compared them with the profile obtained for the eutopic endometrium. In line with the current theory of the endometrial origin of endometriosis, the overall methylation profile was highly similar between the endometrium and the lesions. It showed promoter regions consistently hypomethylated or hypermethylated (more than 1.5-times, as compared with endometrium) and others specific to one given subtype. Albeit there was no systematic correlation between promoter methylation and expression of nearby genes, 35 genes had both methylation and expressional alterations in the lesions. These genes, reported here for the first time, might be of interest in the development of endometriosis. In addition, hypermethylated regions were located at the ends of the chromosomes, whereas hypomethylated regions were randomly distributed all along the chromosomes. We postulated that this original observation might participate to the chromosomal stability and protect the endometriotic lesion against malignancy.
Figures


References
-
- Simoens S, Hummelshoj L, D'Hooghe T2007. Endometriosis: cost estimates and methodological perspective. Hum Reprod Update 13:395–404 - PubMed
-
- Giudice LC, Kao LC2004. Endometriosis. Lancet 364:1789–1799 - PubMed
-
- Bulun SE2009. Endometriosis. N Engl J Med 360:268–279 - PubMed
-
- Chapron C, Bourret A, Chopin N, Dousset B, Leconte M, Amsellem-Ouazana D, de Ziegler D, Borghese B2010. Surgery for bladder endometriosis: long-term results and concomitant management of associated posterior deep lesions. Hum Reprod 25:884–889 - PubMed
-
- Fauconnier A, Chapron C2005. Endometriosis and pelvic pain: epidemiological evidence of the relationship and implications. Hum Reprod Update 11:595–606 - PubMed
Publication types
MeSH terms
Substances
LinkOut - more resources
Full Text Sources
Other Literature Sources
Medical
Molecular Biology Databases
Research Materials
