. 2010 Oct;24(10):1935-48.
doi: 10.1210/me.2010-0005. Epub 2010 Aug 4.

Conformation of the mineralocorticoid receptor N-terminal domain: evidence for induced and stable structure

Affiliations

Conformation of the mineralocorticoid receptor N-terminal domain: evidence for induced and stable structure

Katharina Fischer et al. Mol Endocrinol. 2010 Oct.

Abstract

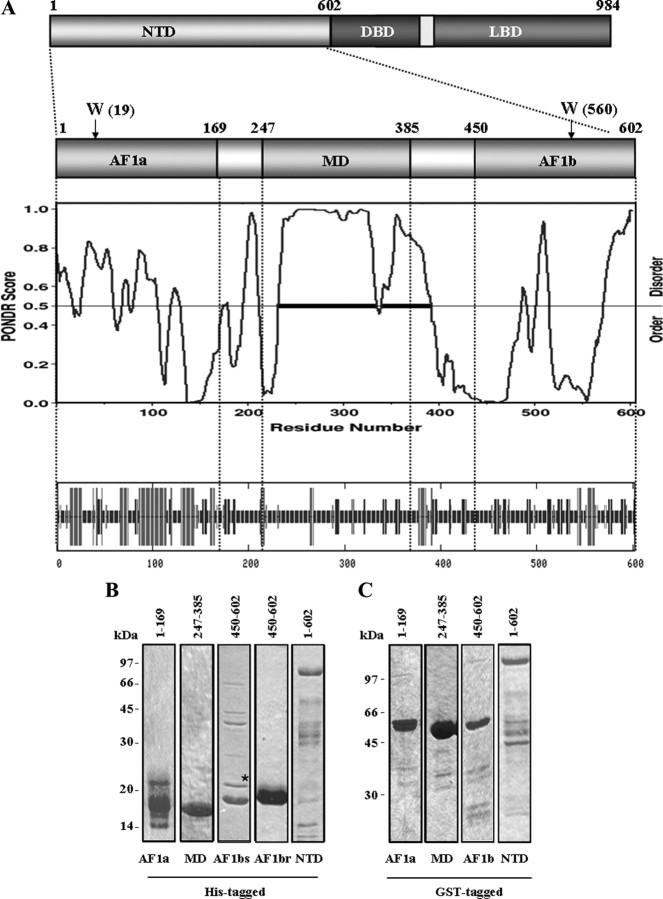
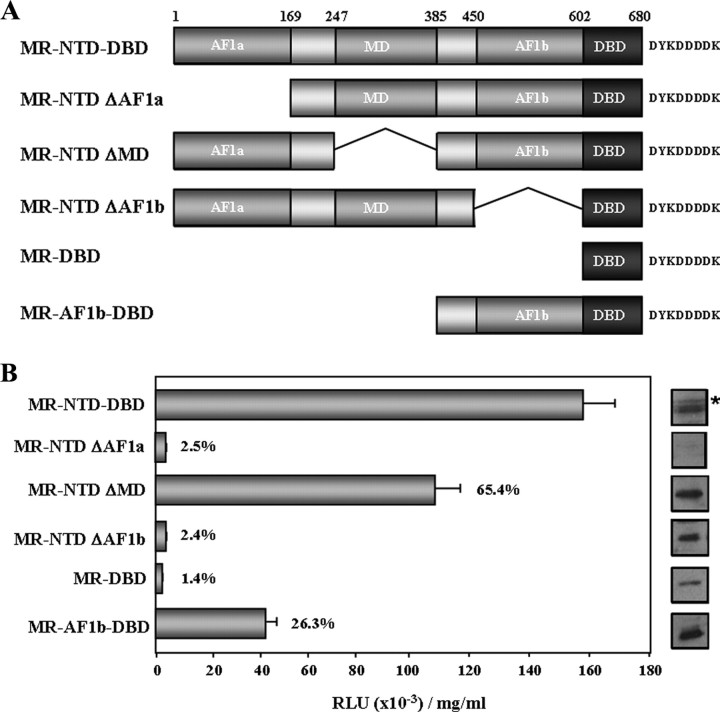
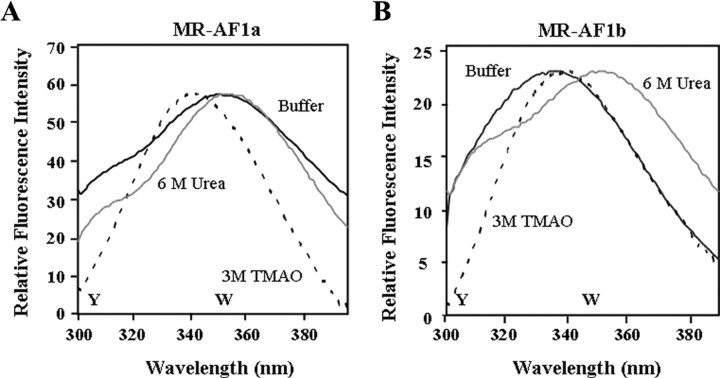
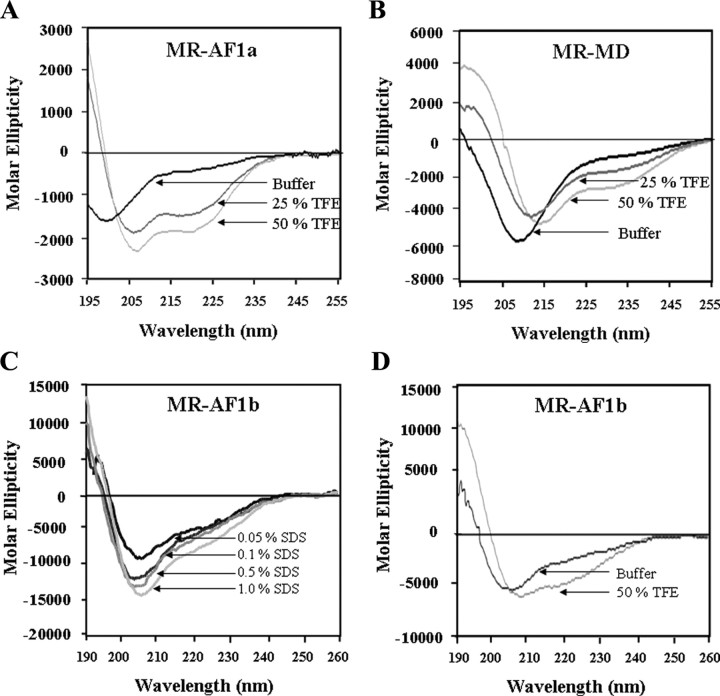
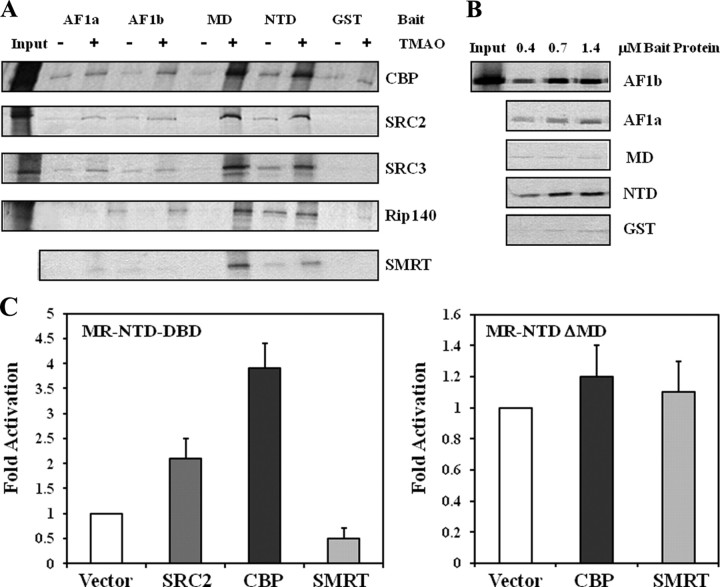
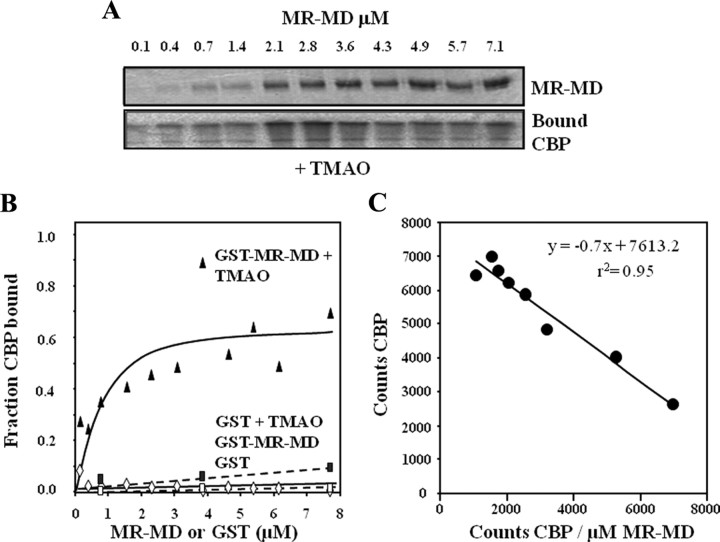
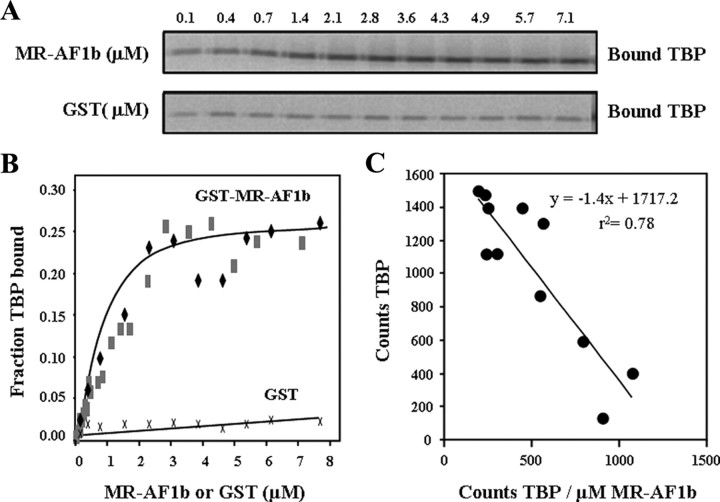
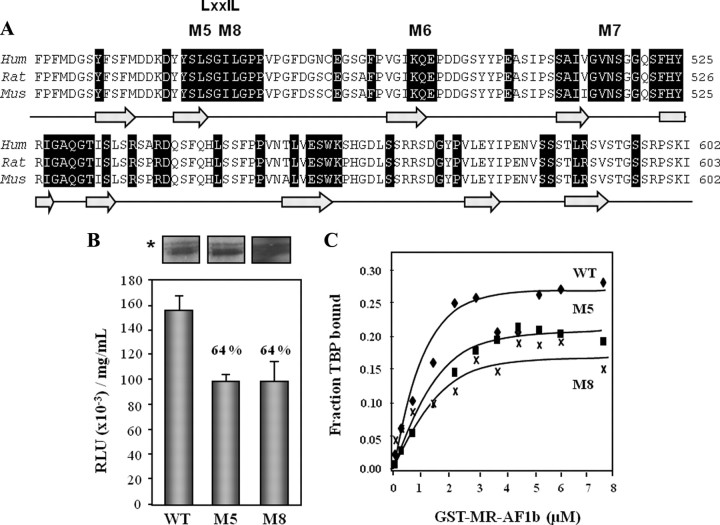
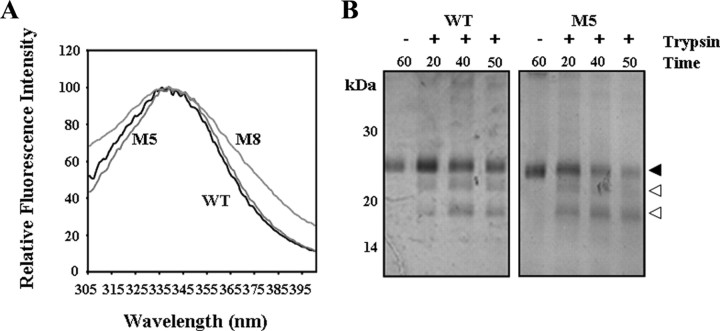
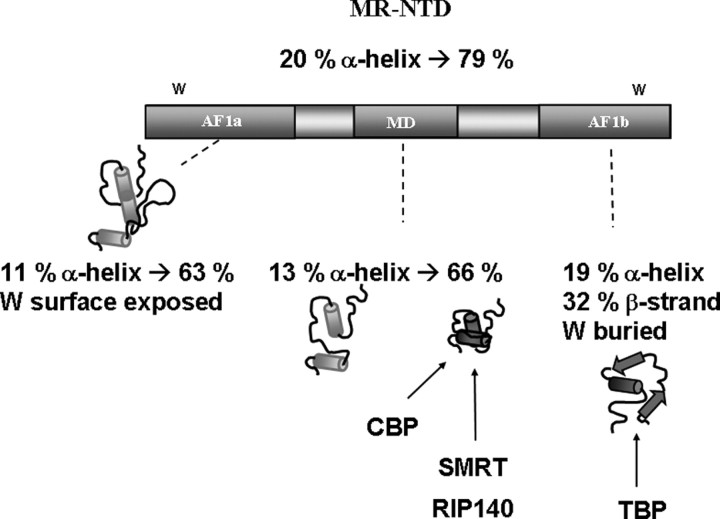
The mineralocorticoid receptor (MR) binds the steroid hormones aldosterone and cortisol and has an important physiological role in the control of salt homeostasis. Regions of the protein important for gene regulation have been mapped to the amino-terminal domain (NTD) and termed activation function (AF)1a, AF1b, and middle domain (MD). In the present study, we used a combination of biophysical and biochemical techniques to investigate the folding and function of the MR-NTD transactivation functions. We demonstrate that MR-AF1a and MR-MD have relatively little stable secondary structure but have the propensity to form α-helical conformation. Induced folding of the MR-MD enhanced protein-protein binding with a number of coregulatory proteins, including the coactivator cAMP response element-binding protein-binding protein and the corepressors SMRT and RIP140. By contrast, the MR-AF1b domain appeared to have a more stable conformation consisting predominantly of β-secondary structure. Furthermore, MR-AF1b specifically interacted with the TATA-binding protein, via an LxxLL-like motif, in the absence of induced folding. Together, these data suggest that the MR-NTD contains a complex transactivation system made up of distinct structural and functional domains. The results are discussed in the context of the induced folding paradigm for steroid receptor NTDs.


Figures

Fig. 1.
Fig. 1.
MR domain organization and purified recombinant proteins. A, Schematic drawing of the hMR showing the domain organization. Numbers indicate amino acid positions. Below is an enlarged view of the MR-NTD, amino acids 1-602, highlighting the three domains important for MR-dependent gene regulation: AF1a, MD, and AF1b (12 13 14 ). The location of two tryptophan (W) residues is also indicated. Below are two structure prediction plots: a PONDR plot (56 57 ), which is a prediction of natural disordered structure (positive peaks above 0.5), and below, the predictions of secondary structure using Network Protein Sequence Analysis (see http://pbil.ibcp.fr/htm/index.php) (58 ): the large bars represent α-helix, small bars represent β-strand, and the middle line represents nonordered structure. B, Coomassie-stained gel of purified His-tagged MR-AF1a, MR-MD, MR-AF1b polypeptides, and MR-NTD. MR-AF1b was purified from the insoluble (AF1br) or soluble (AF1bs) bacterial fractions. An asterisk indicates the copurifying bacterial FKBP type chaperone. The amount of protein loaded was 7.0, 2.0, 4.6, 3.0, and 1.7 μg for MR-AF1a, MR-MD, MR-AF1bs, MR-AF1br, and NTD, respectively. C, Coomassie-stained gel of purified GST-tagged MR-AF1a, MR-MD, AF1b, and NTD polypeptides. The amount of protein loaded was 2.7, 6.0, 1.0, and 2.8 μg for MR-AF1a, MR-MD, MR-AF1b, and MR-NTD, respectively.
Fig. 2.
Fig. 2.
Reporter gene activity for MR-NTD-DBD and AF1 deletions. A, Schematic representation of the MR-NTD-DBD-FLAG construct and the transactivation domain deletions. B, The wild-type or mutant MR-NTD-DBD constructs were transfected along with a (GRE)2-TATA-luciferase reporter gene into COS-1 cells and transactivation activity measured. Transfections were done in triplicate, and the mean ± sd is shown. On the right is shown a Western blot analysis of the expressed proteins detected with an anti-FLAG antibody. An asterisk indicates a nonspecific protein detected in some blots. The % activity relative to the wild-type protein (100%) is also shown.
Fig. 3.
Fig. 3.
Steady-state fluorescence emission spectra for MR-AF1a and MR-AF1b. A and B, The steady-state fluorescence emission spectra for His-tagged MR-AF1a and MR-AF1br, respectively, in either phosphate buffer (black line), 6 m urea (gray line), or 3 m TMAO (broken line) after excitation at 278 nm. The data are a representative experiment, and the results of at least three independent experiments showing the mean value ± sd are summarized in Table 1. W and Y represent the emission wavelength for tryptophan and tyrosine, respectively, for the proteins in buffer.
Fig. 4.
Fig. 4.
Secondary structure analysis of the MR-NTD transactivation functions. A and B, Far-UV CD spectra for the MR-AF1a and MR-MD domains, at concentrations of 0.5–0.8 mg/ml, recorded in buffer (black line) or 25 or 50% TFE (gray lines). Estimates of secondary structure are summarized in Table 2. C, Far-UV CD spectra for the MR-AF1br, at concentrations in the range from 0.07 to 0.2 mg/ml, were recorded in increasing concentrations of SDS. Spectra are characteristic for a mixed α/β protein, with primarily β-secondary structure as summarized in Table 2. D, As for C, except 50% TFE was included in buffer (gray line).
Fig. 5.
Fig. 5.
In vitro protein-protein interactions. A, GST pull-down assays were performed with 0.7 μm bait protein (GST, GST-MR-NTD, GST-MR-AF1a, GST-MR-MD, or GST-MR-AF1b) and in vitro synthesized and radiolabeled coactivators (SRC2, SRC3, and CBP) and corepressors (SMRT and Rip140). Experiments were done in the absence (−) or presence (+) of 3 m TMAO. The results are representative of at least two independent experiments; 10% of the input labeled protein is indicated. B, A representative experiment showing binding of the general transcription factor TBP to increasing concentrations of GST alone or GST-MR polypeptides. Preferential binding to AF1b and NTD was observed in the absence of TMAO. Quantitation of the gels shown was as follows: AF1b: 4, 28, and 29 arbitrary units; NTD: 10.6, 16.8, and 20.8 arbitrary units; and AF1a: 1, 5.3, and 6.9 arbitrary units, respectively. C, The wild-type (MR-NTD-DBD) or mutant (MR-NTD-ΔMD-DBD) constructs were transfected along with a (GRE)2-TATA-luciferase reporter gene into COS-1 cells, with or without the coregulatory proteins CBP, SRC2, or SMRT and transactivation activity measured. Transfections were done in duplicate or triplicate, and the mean fold activation ± sd is shown for one or two experiments.
Fig. 6.
Fig. 6.
Binding of CBP to the MR-MD in the presence of TMAO. A, The binding of CBP was measured in the presence of increasing concentrations of GST alone (not shown) or GST-MR-MD in the absence (not shown) or presence of TMAO (+). Bound CBP was analyzed after SDS-PAGE and exposure of the dried gel to a phosphoimaging plate and visualized by AIDA software as depicted (Bound CBP). B, Bound CBP (A) was quantified using AIDA software and plotted as fraction of CBP bound vs. concentration of GST (squares) or GST-MR-MD (triangles) (μM) ± TMAO (filled or open symbols). The result represents the pooled data from two independent experiments. C, A Eadie-Hofstee plot of the binding data in the presence of TMAO shown in B, from which the dissociation constant, Kd, was calculated.
Fig. 7.
Fig. 7.
Binding of TBP to the MR-AF1b domain. A, The binding of TBP was measured in the presence of increasing concentrations of GST alone or GST-MR-AF1b. Bound TBP was analyzed after SDS-PAGE and exposure of the dried gel to a phosphoimaging plate and visualized by AIDA software as depicted. B, Bound TBP (A) was quantified using AIDA software and plotted as fraction of TBP bound vs. concentration of GST (x) or GST-MR-AF1b (filled squares/diamonds). Two independent titrations are plotted for the binding to MR-AF1b, and the results are representative of at least three independent experiments. C, A linear Eadie-Hofstee plot of the binding data in the presence of TMAO shown in B, from which the dissociation constant, Kd, was calculated.
Fig. 8.
Fig. 8.
Mutation of polar and hydrophobic amino acids impair transactivation and TBP binding. A, Primary amino acid sequence alignment of the MR-AF1b domain from human, rat, and mouse; up to 10 additional species were included in the full analysis, including the receptor sequence from Xenopus and several fish species. Black represents residues conserved in all species studied. The boxes represent three triple mutations M5 (S468A, L469A, and S470A), M6 (K497A, Q495A, and E496A), and M7 (V516A, N517A, and S518A), which were introduced into MR-NTD or MR-AF1b. A single point mutation, M8 (L489A), is also indicated. Secondary structure predictions are shown below the sequence alignment: arrows represent β-strand, and the lines represent random coil. B, The mutant or wild-type MR-NTD-DBD-FLAG constructs were transfected into COS-1 cells together with the (GRE)2-TATA-luciferase reporter gene and transactivation activity measured. Transfections were done in triplicate, and the mean ± sd is shown. Above is shown a Western blot analysis of the expressed proteins detected with a anti-FLAG antibody. An asterisk indicates a nonspecific protein detected in blots for the MR-NTD-FLAG constructs. The % activity relative to the wild-type protein (100%) is also shown. C, The binding of TBP was measured in the presence of increasing concentrations of GST alone or GST-MR-AF1b wild-type (filled diamonds) or the M5 (filled squares) and M8 (x) mutant polypeptides. Bound TBP was quantified using AIDA software and plotted as fraction of TBP bound vs. concentration of GST-MR-AF1b polypeptide (μm). An estimate of the dissociation constant, Kd, for the different MR-AF1b-TBP binding interactions was calculated as described in the legends to Figs. 6 and 7 and the results summarized in Table 3. The data for M5 are from a single experiment, whereas the data for M8 are representative of two independent experiments.
Fig. 9.
Fig. 9.
Mutating residues in a LxxIL motif does not alter gross structure. A, The steady-state fluorescence spectra for wild-type (WT) and M5 AF1br polypeptides are shown. The λmax for tryptophan emission was similar for all three proteins (WT, 336 nm; M5, 339 nm; and M8, 338 nm). B, Limited proteolysis of wild-type and M5 MR-AF1b. The polypeptides were digested with trypsin for the time points indicated and the fragments resolved by SDS-PAGE and detected by Coomassie staining. The pattern of fragments generated (open arrow heads) was essentially identical for both polypeptides.
Fig. 10.
Fig. 10.
Summary of the structural and functional properties of the modular MR-NTD transactivation function. Schematic drawing of the MR-NTD showing the three transactivation domains and the position of two tryptophan residues (W). Selected secondary structure content is summarized, and induced folding in the presence of TMAO or TFE is indicated by an arrowhead and the solid cylinders and arrows. The binding of coregulatory proteins to MR-MD and MR-AF1b is also shown.

Similar articles

Cited by

References

    1. Lifton RP, Gharavi AG, Geller DS2001. Molecular mechanisms of human hypertension. Cell 104:545–556 - PubMed
    1. Zennaro MC, Lombès M2004. Mineralocorticoid resistance. Trends Endocrinol Metab 15:264–270 - PubMed
    1. Rogerson FM, Brennan FE, Fuller PJ2004. Mineralocorticoid receptor binding, structure and function. Mol Cell Endocrinol 217:203–212 - PubMed
    1. Fuller PJ, Young MJ2005. Mechanisms of mineralocorticoid action. Hypertension 46:1227–1235 - PubMed
    1. Viengchareun S, Le Menuet D, Martinerie L, Munier M, Pascual-Le Tallec L, Lombès M2007. The mineralocorticoid receptor: insights into its molecular and (patho)physiological biology. Nucl Recept Signal 5:e012 - PMC - PubMed

Publication types

MeSH terms

Substances