. 2010 Oct;151(10):4926-37.
doi: 10.1210/en.2010-0573. Epub 2010 Aug 4.

Contribution of a membrane estrogen receptor to the estrogenic regulation of body temperature and energy homeostasis

Affiliations

Contribution of a membrane estrogen receptor to the estrogenic regulation of body temperature and energy homeostasis

Troy A Roepke et al. Endocrinology. 2010 Oct.

Abstract

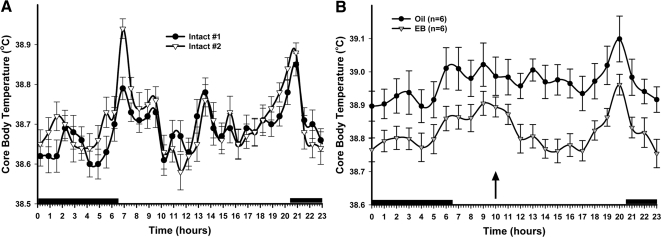
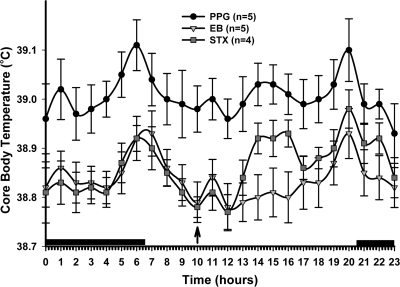
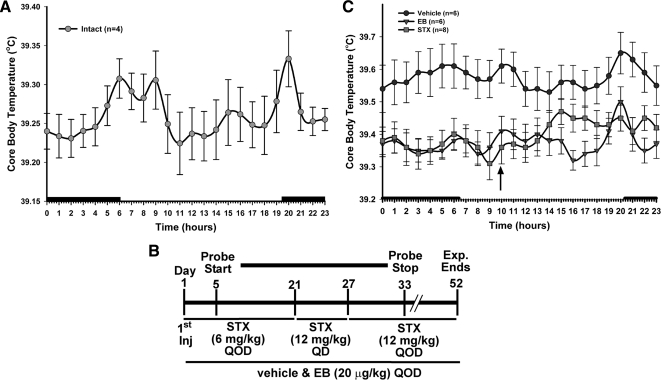
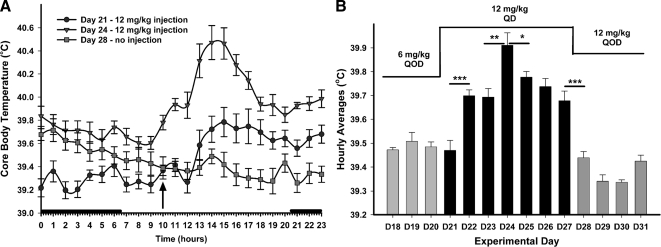
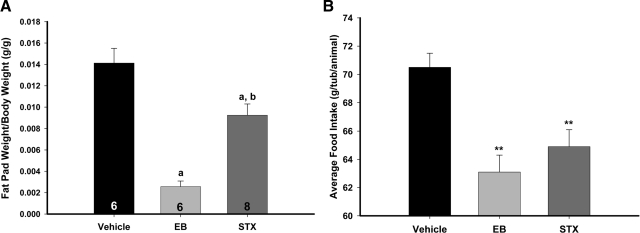
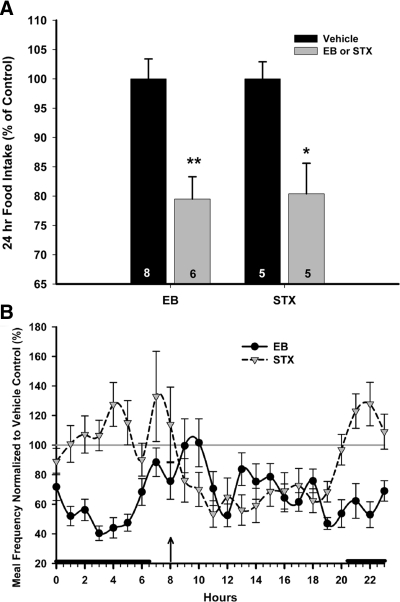
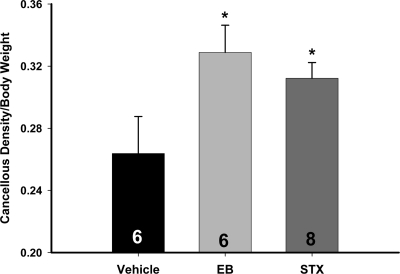
The hypothalamus is a key region of the central nervous system involved in the control of homeostasis, including energy and core body temperature (Tc). 17β-Estradiol (E2) regulates Tc, in part, via actions in the basal hypothalamus and preoptic area. E2 primarily controls hypothalamic functions via the nuclear steroid receptors, estrogen receptor α/β. However, we have previously described an E2-responsive, Gq-coupled membrane receptor that reduces the postsynaptic inhibitory γ-aminobutyric acid-ergic tone and attenuates postovariectomy body weight gain in female guinea pigs through the administration of a selective Gq-mER ligand, STX. To determine the role of Gq-mER in regulating Tc, energy and bone homeostasis, ovariectomized female guinea pigs, implanted ip with temperature probes, were treated with STX or E2 for 7-8 wk. Tc was recorded for 4 wk, whereas food intake and body weight were monitored daily. Bone density and fat accumulation were determined postmortem. Both E2 and STX significantly reduced Tc in the females compared with controls. STX, similar to E2, reduced food intake and fat accumulation and increased tibial bone density. Therefore, a Gq-mER-coupled signaling pathway appears to be involved in maintaining homeostatic functions and may constitute a novel therapeutic target for treatment of hypoestrogenic symptoms.


Figures

Figure 1
Figure 1
The Tc of intact and ovariectomized female guinea pigs treated with either vehicle or EB. A, Dataloggers were implanted into two intact females to record Tc for 36 d with recordings every 40 min. Both females exhibited a crepuscular rhythm in Tc, where the peaks were associated with increases in activity at dawn and dusk. The dark bars above the x-axis represent lights off or nighttime. B, EB (8 μg/kg M-W-F, n = 6) significantly decreased the Tc compared with the vehicle (n = 6). The data are presented as the mean ± sem for each hour of the day averaged over the last 21 d of the temperature probe recordings. An arrow indicates time of injection. The data were analyzed using a two-way ANOVA (P < 0.05, F = 5.773, df = 1) with post hoc Newman-Keuls multiple comparison test. All data points in EB-treated females were significantly different from vehicle controls (P < 0.01).
Figure 2
Figure 2
The Tc of ovariectomized female guinea pigs treated with either vehicle, EB, or STX. The Gq-mER-selective ligand STX (6 mg/kg M-W-F, n = 4) significantly decreased the Tc compared with the PPG vehicle (n = 5) but was not significantly different from the EB group (8 μg/kg M-W-F, n = 5). The data are presented as the mean ± sem for each hour of the day averaged over the last 21 d of the temperature probe recordings. An arrow indicates time of injection. The data were analyzed using a two-way ANOVA (P < 0.05, F = 4.787, df = 2) with post hoc Newman-Keuls multiple comparison test. All data points for both STX and EB were significantly different from vehicle with a P < 0.01 with the exception of the STX 1400- to 1600-h time points (P < 0.05). The dark bars above the x-axis represent lights off or nighttime.
Figure 3
Figure 3
Examination of the dose effect of STX on Tc. A, A new set of dataloggers was implanted into four intact females to record Tc for 63 d (45-min recording intervals). Dark bars above the x-axis represent lights off. B, To determine a dose effect of STX, ovariectomized female guinea pigs, implanted with temperature probes, were divided into three groups (vehicle, EB, or STX) and injected on d 1 with either vehicle (PPG, n = 6), EB (20 μg/kg in oil, n = 6), or STX (6 mg/kg in PPG, n = 8) QOD at 1000 h. Vehicle- and EB-treated females were injected as described for the entire 52-d experiment. On d 5, the probes began recording Tc and continued recording until d 33. On d 21, the STX-treated females were injected QD for 1 wk with 12 mg/kg. On d 27 (no injection d 28), the regimen frequency was reduced to 12 mg/kg QOD for the remainder of the experiments until d 52. C, STX (6–12 mg/kg QOD, n = 8) and EB (20 μg/kg, n = 6) significantly decreased the Tc compared with the vehicle (n = 6). Data are presented as the mean ± sem for each hour of the day averaged over the last 21 d of the probe recordings for vehicle- and EB-treated females and the first 14 (6 mg/kg QOD) and the last 7 d (12 mg/kg QOD) for STX-treated females. An arrow indicates time of injection. The data were analyzed using a two-way ANOVA (P < 0.05, F = 5.202, df = 2) with post hoc Newman-Keuls multiple comparison test. All STX and EB data points were significantly different from vehicle with a P < 0.01 with the exception of the late evening hours in the STX-treated females (P < 0.05).
Figure 4
Figure 4
High doses of STX increase Tc. A, On d 21, the frequency of STX treatment was increased to 12 mg/kg QD for 7 d. The higher dose of STX increased the baseline hourly temperatures and the afternoon peak immediately and continued to increase these parameters reaching a maximum effect on the fourth day (d 24). The increase in Tc was eliminated immediately upon cessation of the daily injections (d 28). Each symbol represents the mean ± sem of the eight STX-treated females. An arrow indicates time of injection. A two-way ANOVA reported a significant difference between d 21, 24, and 28 (P < 0.0001, F = 14.01, df = 2). An analysis of STX serum levels using liquid chromatography-mass spectrometry assay (Debarber, A., E. A. Rick, T. S. Scanlan, O. K. Rønnekleiv, and M. J. Kelly, unpublished data) showed that STX levels are 2.5-fold higher 24 h after injection with a 12 mg/kg dose vs. the 6 mg/kg dose. B, The higher dose of STX increased the average hourly temperatures for each day and continued to increase these parameters reaching a maximum effect on the fourth day (d 24). The increase in Tc was abrogated immediately upon cessation of the daily injections (d 28). Each bar represents the hourly mean for each day ± sem of the eight STX-treated females (*, P < 0.05; **, P < 0.01; ***, P < 0.001; Newman-Keuls pairwise comparison). A two-way ANOVA reported a significant difference between doses (P < 0.001, F = 13.3, df = 2). The 3 d before the increase are a representative of the first 16 d of the temperature recordings (d 5–20). The average daily Tc for the first 16 d was 39.41 ± 0.02 C.
Figure 5
Figure 5
STX and EB decrease food intake and peripheral fat accumulation in ovariectomized female guinea pigs. A, STX and EB reduced the dorsal abdominal and periuterine fat pads. The female guinea pigs were ovariectomized and administered QOD sc injections of vehicle (n = 6), EB (20 μg/kg, n = 6), or STX (6–12 mg/kg, n = 8). Bars represent the mean ± sem for each treatment in fat (g)/body weight (g). A one-way ANOVA (P < 0.0001, F = 153.5, df = 2) followed by a post hoc Newman-Keuls multiple comparison test was used to compare significance between each treatment. a, P < 0.001, vehicle and STX vs. EB and; b, P < 0.01, vehicle vs. STX. B, Both STX and EB significantly attenuated food intake in female guinea pigs compared with vehicle. A one-way ANOVA (P < 0.0001, F = 24.96, df = 2) followed by a post hoc Newman-Keuls multiple comparison test revealed a significant effect of EB and STX compared with vehicle (**, P < 0.01). Bars represent the mean ± sem of the 48 d of the food intake measurements.
Figure 6
Figure 6
STX decreases hourly food intake in ovariectomized female guinea pigs. A, A CLAMS unit was used to monitor daily and hourly food intake, as well as meal frequency, size, and duration, in ovariectomized, female guinea pigs. After an acclimation period, the animals were subject to 24-h monitoring of the aforementioned feeding parameters for 7 d under ad libitum conditions. Each morning at 0800 h, the animals were weighed and injected with either PPG (150 μl; sc, n = 5) or STX (6 mg/kg; sc in PPG, n = 5) QOD for 7 d (i.e. on d 1, 3, 5, and 7 of the monitoring period.). For EB treatment, EB (20 μg/kg; sc, n = 6) or the sesame oil vehicle (100 μl; sc, n = 8) was administered. The bars represent means ± sem of the daily food intake that was normalized to values obtained from the vehicle-treated control animals. The daily food intake was analyzed using a one-way ANOVA (P < 0.0001, F = 7.393, df = 3) followed by a post hoc Newman-Keuls multiple comparison test (*, P ≤ 0.05; **, P ≤ 0.01). B, Meal frequency (meals/hour) was analyzed hourly during the 7 d of the experiment and normalized to average control values (%). The dark circles represent EB-treated females (mean ± sem for the previous hour), and the gray triangles represent STX-treated females. The arrow indicates time of injection (0800 h), and the dark bars above the x-axis represent lights off. Meal frequency was analyzed using a two-way ANOVA repeated measures (P < 0.0001, F = 154.18, df = 1 for EB; P < 0.001, F = 12.42, df = 1 for STX).
Figure 7
Figure 7
Cancellous bone density of the proximal tibia in ovariectomized female guinea pig was increased by EB and STX. After the 52-d treatment, ovariectomized females treated with EB (20 μg/kg) or STX (12 mg/kg) had significantly higher bone density in the proximal tibia compared with the vehicle-treated females. On d 52, the animals were killed and tibiae were harvested. The trabecular bone region was scanned using quantitative computer tomography (30). A one-way ANOVA (P < 0.05, F = 3.616, df = 2) followed by a post hoc Newman-Keuls multiple comparison test (*, P < 0.05) was used to compare significance between each treatment.

Similar articles

Cited by

References

    1. Koehl M, Battle SE, Turek FW 2003 Sleep in female mice: a strain comparison across the estrous cycle. Sleep 26:267–272 - PubMed
    1. Rashotte ME, Ackert AM, Overton JM 2002 Ingestive behavior and body temperature during the ovarian cycle in normotensive and hypertensive rats. Am J Physiol Regul Integr Comp Physiol 282:R216–R225 - PubMed
    1. Yochim JM, Spencer F 1976 Core temperature in the female rat: effect of ovariectomy and induction of pseudopregnancy. Am J Physiol 231:361–365 - PubMed
    1. Czaja JA, Butera PC 1986 Body temperature and temperature gradients: changes during the estrous cycle and in response to ovarian steroids. Physiol Behav 36:591–596 - PubMed
    1. Coyne MD, Kesick CM, Doherty TJ, Kolka MA, Stephenson LA 2000 Circadian rhythem changes in core temperature over the menstrual cycle: method for noninvasive monitoring. Am J Physiol Regul Intergr Comp Physiol 279:R1316–R1320 - PubMed

Publication types

MeSH terms

Substances