. 2010 Oct;151(10):4678-87.
doi: 10.1210/en.2010-0289. Epub 2010 Aug 4.

Glucagon-like peptide-1 receptor knockout mice are protected from high-fat diet-induced insulin resistance

Affiliations

Glucagon-like peptide-1 receptor knockout mice are protected from high-fat diet-induced insulin resistance

Julio E Ayala et al. Endocrinology. 2010 Oct.

Abstract

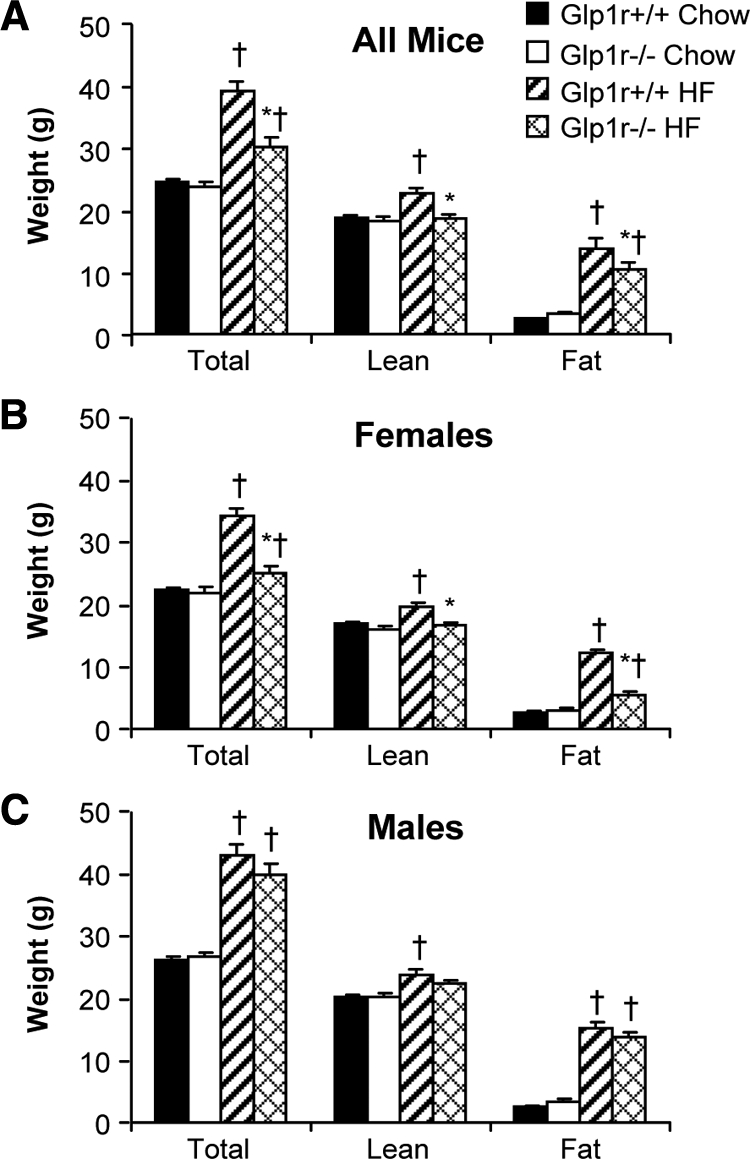
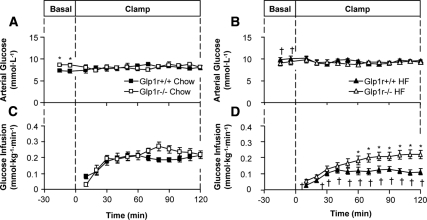
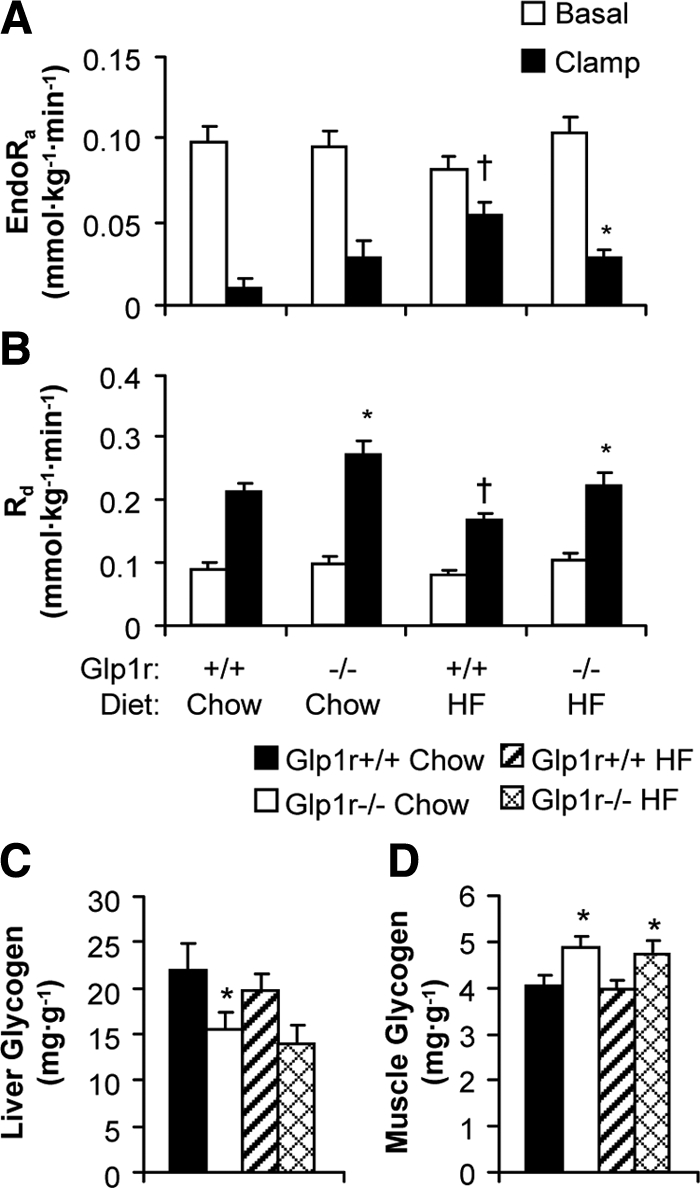
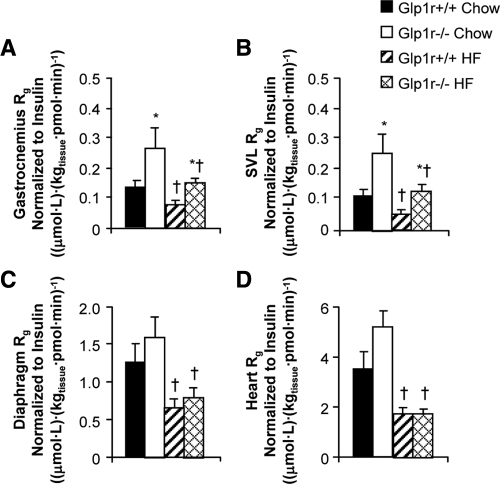
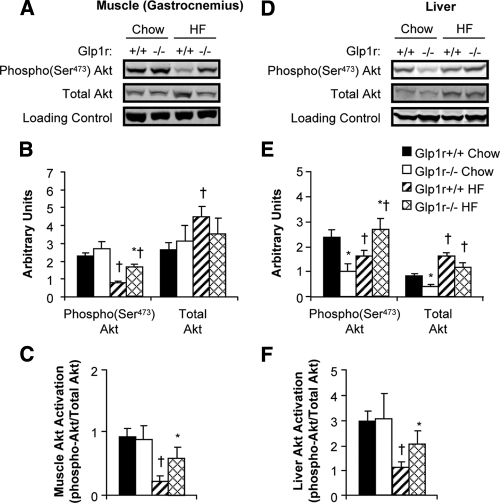
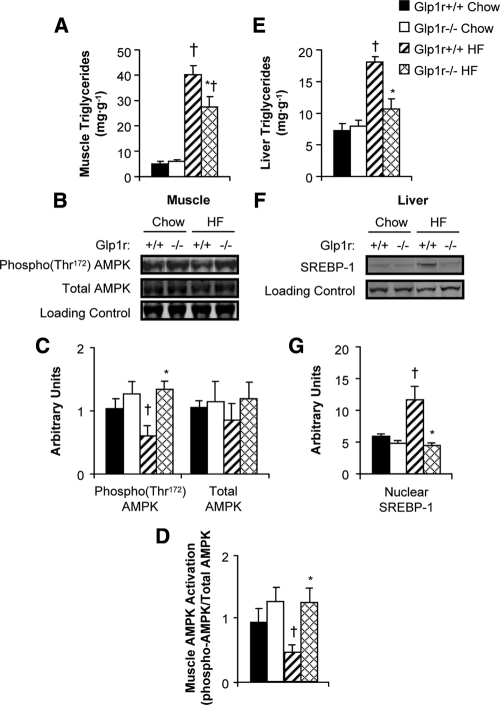
Glucagon-like peptide-1 augments nutrient-stimulated insulin secretion. Chow-fed mice lacking the glucagon-like peptide-1 receptor (Glp1r) exhibit enhanced insulin-stimulated muscle glucose uptake but impaired suppression of endogenous glucose appearance (endoRa). This proposes a novel role for the Glp1r to regulate the balance of glucose disposal in muscle and liver by modulating insulin action. Whether this is maintained in an insulin-resistant state is unknown. The present studies tested the hypothesis that disruption of Glp1r expression overcomes high-fat (HF) diet-induced muscle insulin resistance and exacerbates HF diet-induced hepatic insulin resistance. Mice with a functional disruption of the Glp1r (Glp1r-/-) were compared with wild-type littermates (Glp1r+/+) after 12 wk on a regular chow diet or a HF diet. Arterial and venous catheters were implanted for sampling and infusions. Hyperinsulinemic-euglycemic clamps were performed on weight-matched male mice. [3-(3)H]glucose was used to determine glucose turnover, and 2[14C]deoxyglucose was used to measure the glucose metabolic index, an indicator of glucose uptake. Glp1r-/- mice exhibited increased glucose disappearance and muscle glucose metabolic index on either diet. This was associated with enhanced activation of muscle Akt and AMP-activated protein kinase and reduced muscle triglycerides in HF-fed Glp1r-/- mice. Chow-fed Glp1r-/- mice exhibited impaired suppression of endoRa and hepatic insulin signaling. In contrast, HF-fed Glp1r-/- mice exhibited improved suppression of endoRa and hepatic Akt activation. This was associated with decreased hepatic triglycerides and impaired activation of sterol regulatory element-binding protein-1. These results show that mice lacking the Glp1r are protected from HF diet-induced muscle and hepatic insulin resistance independent of effects on total fat mass.


Figures

Figure 1
Figure 1
Total, lean, and fat mass in all (A), female (B), and male (C) mice at 4 months of age. Shown are results for chow-fed Glp1r+/+ (black bars; n = 16 female, 14 male), chow-fed Glp1r−/− (white bars; n = 12 female, 13 male), HF-fed Glp1r+/+ (striped bars; n = 15 female, 16 male) and HF-fed Glp1r−/− (diamond pattern bars; n = 13 female, 17 male) mice. Data are shown as mean ± sem *P < 0.05 vs. Glp1r+/+, same diet; †P < 0.05 vs. Chow, same genotype.
Figure 2
Figure 2
Arterial glucose (A and B) and GIR (C and D) during insulin clamps in chow-fed (squares) and HF-fed (triangles) mice. Glp1r+/+ mice are represented by black symbols, whereas Glp1r−/− mice are represented by white symbols. Data are shown as mean ± sem for 8–10 mice/genotype and diet. *P < 0.05 vs. Glp1r+/+, same diet; †P < 0.05 vs. Chow, same genotype.
Figure 3
Figure 3
EndoRa (A) and Rd (B) during basal conditions (white bars) and during insulin clamps (black bars). Basal values are averaged from plasma samples obtained at t = −15 and −5 min before onset of insulin clamps. Clamp values are averaged from plasma samples obtained at t = 80 to 120 min of the insulin clamps. Liver (C) and gastrocnemius muscle (D) glycogen levels at the end of insulin clamps. Shown are results for chow-fed Glp1r+/+ (black bars), chow-fed Glp1r−/− (white bars), HF-fed Glp1r+/+ (striped bars) and HF-fed Glp1r−/− (diamond pattern bars) mice. Data are shown as mean ± sem for 8–10 mice/genotype and diet. *P < 0.05 vs. Glp1r+/+, same diet; †P < 0.05 vs. Chow, same genotype.
Figure 4
Figure 4
Glucose metabolic index (Rg) in gastrocnemius (A), superficial vastus lateralis (B), diaphragm (C), and heart (D) during insulin clamps. Shown are results for chow-fed Glp1r+/+ (black bars), chow-fed Glp1r−/− (white bars), HF-fed Glp1r+/+ (striped bars) and HF-fed Glp1r−/− (diamond pattern bars) mice. Values for Rg are normalized to clamp insulin levels. Data are shown as mean ± sem for 8–10 mice/genotype and diet. *P < 0.05 vs. Glp1r+/+, same diet; †P < 0.05 vs. Chow, same genotype.
Figure 5
Figure 5
Immunoblots for insulin signaling proteins after insulin clamp experiments. Representative immunoblots from gastrocnemius muscle (A) and liver (D) extracts are shown. Quantification of protein content for phosphorylated and total Akt (B and E) and Akt activation (C and F) is shown for chow-fed Glp1r+/+ (black bars), chow-fed Glp1r−/− (white bars), HF-fed Glp1r+/+ (striped bars) and HF-fed Glp1r−/− (diamond pattern bars) mice. GAPDH was used as a loading control. Data are shown as mean ± sem for 8–10 mice/genotype and diet. *P < 0.05 vs. Glp1r+/+, same diet; †P < 0.05 vs. Chow, same genotype.
Figure 6
Figure 6
Gastrocnemius muscle (A) and liver (E) triglyceride levels in chow-fed Glp1r+/+ (black bars), chow-fed Glp1r−/− (white bars), HF-fed Glp1r+/+ (striped bars) and HF-fed Glp1r−/− (diamond pattern bars) mice after insulin clamps. Representative immunoblots (B) and quantification of protein content (C) for phosphorylated AMPK(Thr172), total AMPK and loading control (GAPDH) from superficial vastus lateralis muscle in 5 h-fasted mice. Muscle AMPK activation (D). Representative immunoblots (F) and quantification of protein content (G) for nuclear SREBP-1 and loading control (YY1) from nuclear extracts isolated from livers after insulin clamps. Data are shown as mean ± sem for 4–10 mice/genotype and diet. *P < 0.05 vs. Glp1r+/+, same diet; †P < 0.05 vs. Chow, same genotype.

Similar articles

Cited by

References

    1. Thorens B 1992 Expression cloning of the pancreatic beta cell receptor for the gluco-incretin hormone glucagon-like peptide 1. Proc Natl Acad Sci USA 89:8641–8645 - PMC - PubMed
    1. Campos RV, Lee YC, Drucker DJ 1994 Divergent tissue-specific and developmental expression of receptors for glucagon and glucagon-like peptide-1 in the mouse. Endocrinology 134:2156–2164 - PubMed
    1. Bullock BP, Heller RS, Habener JF 1996 Tissue distribution of messenger ribonucleic acid encoding the rat glucagon-like peptide-1 receptor. Endocrinology 137:2968–2978 - PubMed
    1. Miyawaki K, Yamada Y, Yano H, Niwa H, Ban N, Ihara Y, Kubota A, Fujimoto S, Kajikawa M, Kuroe A, Tsuda K, Hashimoto H, Yamashita T, Jomori T, Tashiro F, Miyazaki J, Seino Y 1999 Glucose intolerance caused by a defect in the entero-insular axis: a study in gastric inhibitory polypeptide receptor knockout mice. Proc Natl Acad Sci USA 96:14843–14847 - PMC - PubMed
    1. Komatsu R, Matsuyama T, Namba M, Watanabe N, Itoh H, Kono N, Tarui S 1989 Glucagonostatic and insulinotropic action of glucagonlike peptide I-(7–36)-amide. Diabetes 38:902–905 - PubMed

Publication types

MeSH terms