Comparative Study
. 2010 Oct;104(4):1849-66.
doi: 10.1152/jn.00031.2010. Epub 2010 Aug 4.

Multiple Ca2+-dependent mechanisms regulate L-type Ca2+ current in retinal amacrine cells

Affiliations
Comparative Study

Multiple Ca2+-dependent mechanisms regulate L-type Ca2+ current in retinal amacrine cells

Merve Tekmen et al. J Neurophysiol. 2010 Oct.

Abstract

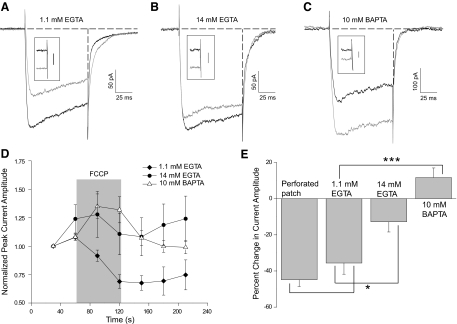
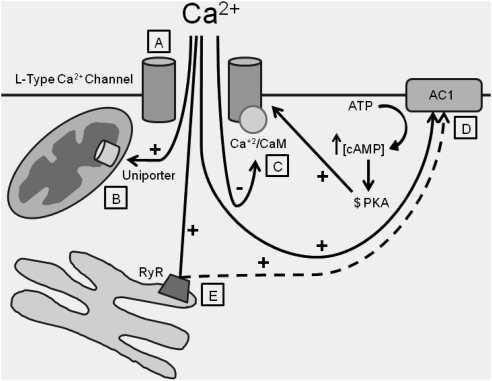
Understanding the regulation of L-type voltage-gated Ca(2+) current is an important component of elucidating the signaling capabilities of retinal amacrine cells. Here we ask how the cytosolic Ca(2+) environment and the balance of Ca(2+)-dependent effectors shape native L-type Ca(2+) channel function in these cells. To achieve this, whole cell voltage clamp recordings were made from cultured amacrine cells under conditions that address the contribution of mitochondrial Ca(2+) uptake (MCU), Ca(2+)/calmodulin (CaM)-dependent channel inactivation (CDI), protein kinase A (PKA), and Ca(2+)-induced Ca(2+) release (CICR). Under control conditions, repeated activation of the L-type channels produces a progressive enhancement of the current. Inhibition of MCU causes a reduction in the Ca(2+) current amplitude that is dependent on Ca(2+) influx as well as cytosolic Ca(2+) buffering, consistent with CDI. Including the Ca(2+) buffer bis-(o-aminophenoxy)-N,N,N',N'-tetraacetic acid (BAPTA) internally can shift the balance between enhancement and inhibition such that inhibition of MCU can enhance the current. Inhibition of PKA can remove the enhancing effect of BAPTA suggesting that cyclic AMP-dependent phosphorylation is involved. Inhibition of CaM suppresses CDI but spares the enhancement, consistent with the substantially higher sensitivity of the Ca(2+)-sensitive adenylate cyclase 1 (AC1) to Ca(2+)/CaM. Inhibition of the ryanodine receptor reduces the current amplitude, suggesting that CICR might normally amplify the activation of AC1 and stimulation of PKA activity. These experiments reveal that the amplitude of L-type Ca(2+) currents in retinal amacrine cells are both positively and negatively regulated by Ca(2+)-dependent mechanisms.


Figures

Fig. 1.
Fig. 1.
The Ca2+ current amplitude increases over time in control conditions. A and C: perforated-patch recordings are shown from 2 different amacrine cells. Cells were depolarized from −70 to 0 mV for 1 s, every 60 s (A and B), or for 100 ms, every 30 s (C and D). Current traces are shown from the time points indicated in B and D. Pairs of traces were selected to show that currents recorded a minute apart are only slightly different in amplitude (A and C, left). These traces were also selected for comparison because traces from similar time points are depicted in subsequent figures. Traces collected further apart in time show that the differences in amplitude are augmented over a longer time frame (A and C, right). B and D: each data point is the mean normalized peak current amplitude elicited by the 2 protocols and plotted over time (30 s n = 6; 60 s n = 4). E: current density (pA/pF) for the current elicited by the 1st voltage step is plotted against its rate of current amplitude increase for each cell. The rate was estimated by drawing a line (fit by eye) through the data at the 1st 3 time points for each cell, then calculating the slopes of those lines. The measurements from all cells depolarized from −70 to 0 mV for 100 ms, every 30 s were included in this analysis. Regression analysis does not reveal a correlation between these 2 quantities (R2 = 0.02).
Fig. 2.
Fig. 2.
Inhibition of mitochondrial Ca2+ uptake (MCU) reduces the Ca2+ current amplitude without altering the voltage of activation. A and B: perforated-patch recordings from an amacrine cell in the absence (black trace) and presence of carbonylcyanide-4-(trifluoromethoxy)-phenylhydrazone (FCCP, gray trace). Amacrine cells were depolarized from −70 to 0 mV for 1 s every 60 s. Representative current traces are from the 3rd and 4th voltage steps. The sustained FCCP-dependent inward current at −70 mV (A, arrow) is due to Na/Ca exchanger activity and has been subtracted from subsequent data. This current is negligible at 0 mV so no subtraction was done for the data collected during the voltage step (B). C: normalized mean peak current amplitude is plotted over time (n = 7). D and E: activation range of the channels was revealed by eliciting currents by steps over a range of voltages (−80 to +10 mV, in 5 mV increments). Two different internal Ca2+ buffering conditions were used (1.1 mM EGTA n = 5, or 10 mM BAPTA n = 4) in ruptured-patch configuration. No FCCP-dependent shift in activation range was observed under either condition in any of the cells tested.
Fig. 3.
Fig. 3.
The effect of inhibiting MCU is dependent on the duration and frequency of depolarization. A and B: perforated-patch recordings from representative amacrine cells depolarized from −70 to 0 mV for either 50 ms (A) or 3 s (B). Steps were delivered every 60 s. Recordings were made in the absence (black traces) and presence (gray traces) of FCCP. C: mean normalized peak current amplitudes are plotted against step number for both step durations (50 ms, n = 7; 3 s, n = 6). D and E: perforated-patch recordings from individual amacrine cells stepped from −70 to 0 mV for 100 ms. Voltage steps were delivered either every 60 s (D) or 5 s. (E). Currents were recorded in the absence (black traces) and presence (gray traces) of FCCP. F: normalized mean peak current amplitude plotted over time for each depolarization frequency (5 s, n = 6; 60 s, n = 7).
Fig. 4.
Fig. 4.
Calcineurin is not a major regulator of the Ca2+ current. A: a representative recording from an amacrine cell showing the Ca2+ current recorded in cyclosporin A (CsA, 1 μM) just prior to the addition of FCCP (black trace) and after 1 min of FCCP exposure (gray trace). Cells were depolarized from −70 to 0 mV for 100 ms once every 30 s. B: the time course of normalized Ca2+ current amplitude is plotted for 6 cells treated with CsA. C: under the same recording conditions as in A and B, CsA alone had no consistent effect on the Ca2+ current (n = 5).
Fig. 5.
Fig. 5.
The effects of inhibiting MCU are dependent on Ca2+ influx. A and B: voltage steps were delivered from – 70 to 0 mV for 1 s, every 60 s in perforated-patch recordings. Recordings were made in external solutions containing either 3 mM Ca2+ or 3 mM Ba2+. Currents are shown from the 3rd (black traces) and 4th voltage steps (in FCCP, gray traces). B, inset: unsubtracted current at −70 mV just prior to the voltage step to 0 mV reveals that the FCCP-dependent Na/Ca exchange current (and thus the FCCP-dependent Ca2+ elevation) persists in external Ba2+. Inset: scale bar is 20 pA. C: mean normalized peak current amplitudes are plotted over time for data collected in both Ca2+ and Ba2+ (n = 7 for each).
Fig. 6.
Fig. 6.
Increasing cytosolic Ca2+ buffering alters the effects of inhibiting MCU. A–C: representative Ca2+ currents recorded in the ruptured-patch configuration with internal solution containing 1.1 mM EGTA (A), 14 mM EGTA (B), or 10 mM bis-(o-aminophenoxy)-N,N,N',N'-tetraacetic acid (BAPTA, C). Dashed lines (A–C) define the 0 current level and the end of the voltage step so that tail currents can be compared under the 3 buffering conditions. Currents were elicited by 100 ms voltage steps from −70 to 0 mV delivered every 30 s. Currents shown are from the 2nd voltage step (black traces) or the 4th voltage step (in FCCP, gray traces). A–C, insets: the unsubtracted current recorded at −70 mV (Na/Ca exchange current) demonstrating the presence of the FCCP-dependent Ca2+ elevation under all 3 Ca2+ buffering conditions. Inset scale bar is 20 pA. D: mean normalized peak current amplitude is plotted over time for the 3 buffering conditions. E: FCCP-dependent changes in current amplitude (comparing data points 2 and 4) are plotted for each buffering condition. Single asterisk, P < 0.05; triple asterisk, P < 0.001.
Fig. 7.
Fig. 7.
Protein kinase A (PKA) and adenylate cyclase (AC) are both involved in regulating the Ca2+ current amplitude. A and B: representative Ca2+ currents recorded in the ruptured-patch configuration with internal solution containing 10 mM BAPTA. Current records are from 2 different cells. Currents were elicited by 100 ms voltage steps from −70 to 0 mV delivered every 30s. Currents shown were elicited from the 2nd (black trace) and 4th (during the treatment, gray trace) voltage steps. Cells were exposed to either the PKA inhibitor N-[2-(p-bromocinnamylamino) ethyl]-5-isoquinolinesulfonamide · 2HCl (H89, A) or H89 + FCCP (B) for 1 min. C: normalized peak current amplitude data are plotted over time. The vertical gray bar indicates the time frame of the 3 treatments. FCCP data from Fig. 6D are re-plotted here for comparison. D: a representative recording from an amacrine cell showing the inhibitory effect of 9-(tetrahydro-2-furanyl)-9H-purin-6-amine, (SQ 22,536) on the Ca2+ current amplitude. E: normalized peak current amplitude data are plotted over time.
Fig. 8.
Fig. 8.
AC1 is expressed in the retina and in cultured retinal cells. A: image of a Western blot showing that the anti-AC1 antibody binds a band at the predicted molecular weight (130 kDa) in both chicken and mouse brain tissue. B–D: fluorescent images of frozen sections of chicken retina treated with Cy3-conjugated secondary antibodies only (B) and the anti-AC1 primary antibody plus the secondary antibody (C and D). The secondary-only controls show low nonspecific binding of the secondary antibody. In C, strong AC1 immunoreactivity is observed in the photoreceptor layer. Also labeled are cells at the inner border of the inner nuclear layer (INL) and in the ganglion cell layer. The labeling pattern is punctate and is most prominent in cell bodies. D: higher magnification view of 2 cells at the inner border of the INL shows that labeling is found on processes extending down into the inner plexiform layer (◀). E–G: fluorescent images of retinal neurons in culture. E: a field of cells labeled with the Cy3-conjugated secondary antibody only shows low nonspecific binding of the secondary antibody. F: a field of retinal neurons is shown, most of which are amacrine cells (←, for example). A strongly labeled cone photoreceptor is also shown (◀). G: a higher magnification image of 3 amacrine cells. As in retinal sections, the labeling pattern of the anti-AC1 antibodies is punctate and appears in cell bodies and processes. All scale bars are 10 μm.
Fig. 9.
Fig. 9.
The effects of inhibition of calmodulin depend on the Ca2+ buffering environment. A and B: representative ruptured-patch recordings from amacrine cells loaded with calmidazolium chloride (CMZ) via the patch pipette. Recordings were made with either 1.1 mM EGTA+CMZ (A) or 10 mM BAPTA+CMZ (B) in the pipette. Current are shown from the 3rd voltage step (black trace) and the 5th voltage step (in FCCP, gray trace). C: mean normalized peak current amplitudes are plotted over time for both recording conditions. D: percent change in Ca2+ current amplitude was determined by comparing the current from the voltage step delivered just before FCCP to that elicited by the voltage step delivered 1 min later (in FCCP). CMZ-free data are re-plotted from Fig. 6E for comparison purposes. Triple asterisk, P < 0.001. Other pair-wise comparisons were not statistically different.
Fig. 10.
Fig. 10.
Phosphodiesterase activity can regulate the Ca2+ current amplitude. A, C, E, and G: representative perforated-patch recordings from 100 ms voltage steps from −70 to 0 mV delivered every 30 s. Both pairs of recordings in each panel (A, C, E, and G) were made from the same amacrine cell. Control traces on the left were obtained from the 1st (black) and 2nd voltage steps (gray). Right: the control current (black) was recorded just prior to the application of 3-isobutyl-1-methylxanthine (IBMX, 2nd voltage step, A, C, and E) or 8-methoxymethyl-1-methyl-3-(2-methylpropyl) xanthine (8-M-IBMX, G). IBMX or 8-M-IBMX traces (gray) were recorded after 30 s of exposure to the reagent (3rd voltage step). Cells were separated into 3 groups based on the effect of IBMX on the Ca2+ current amplitude: cells exhibiting current amplitude increases (A and B, n = 6), cells exhibiting current amplitude decreases (C and D, n = 6) and cells the Ca2+ current of which was unaffected (±<5% change) by IBMX (E and F, n = 11). G: representative recordings from a single amacrine cell using the same protocol as for A, C, and E but with the PDE1 selective inhibitor 8-M-IBMX. 8-M-IBMX produced a small inhibition in all cells examined (n = 12 G and H). B, D, F, and H: mean percent changes in Ca2+ current amplitude are plotted for each group of cells (comparing time points depicted in A, C, E, and G). Single asterisk, P < 0.05; double asterisk, P < 0.01; triple asterisk, P < 0.001.
Fig. 11.
Fig. 11.
Ca2+-induced Ca2+ release (CICR) normally contributes to Ca2+ current enhancement. A and B: the perforated-patch configuration was used to record Ca2+ current from individual amacrine cells with a similar voltage protocol as in Fig. 10. The three pairs of traces in each panel (A and B) are all from the same amacrine cell. Control traces were recorded 30 s apart (A and B, left). Either ryanodine (14 μM, A, middle) or dantrolene (20 μM, B, middle) was used to inhibit activation of the ryanodine receptor. Co-application ryanodine and 8-M-IBMX (A, right) and dantrolene and 8-M-IBMX (B, right) are also shown. C and D, mean percent change in current amplitude (comparing time points depicted in A and B) is plotted for both inhibitors (ryanodine n = 3, dantrolene n = 5). *, P < 0.05; ***, P < 0.001.
Fig. 12.
Fig. 12.
Working model of the Ca2+ -dependent regulation of L-type Ca2+ channels in amacrine cells. A: when the cell is depolarized, L-type voltage-gated Ca2+ channels are opened and Ca2+ influx occurs. B: some fraction of entering Ca2+ is rapidly moved into nearby mitochondria via the uniporter. C: another fraction of the entering Ca2+ binds the channel-associated calmodulin and Ca2+/calmodulin (CaM)-dependent channel inactivation (CDI) is initiated. D: Ca2+ may also bind nonchannel-associated calmodulin that can activate AC1 leading to PKA activity and current amplitude enhancement. E: another target of Ca2+ is the ryanodine receptor, which can lead to CICR and possibly contribute to the Ca2+/CaM-dependent activation of AC1.

Similar articles

Cited by

References

    1. Adler EM, Augustine EJ, Duffy SN, Charlton MP. Alien intracellular calcium chelators attenuate neurotransmitter release at the squid giant synapse. J Neurosci 11: 1496–1507, 1991 - PMC - PubMed
    1. Baccus SA. Timing and computation in inner retinal circuitry. Annu Rev Physiol 69: 271–290, 2007 - PubMed
    1. Bean BP, Nowycky MC, Tsien RW. Beta-adrenergic modulation of calcium channels in frog ventricular heart cells. Nature 307: 371–375, 1984 - PubMed
    1. Beavo JA, Rogers NL, Crofford OB, Hardman JG, Sutherland EW, Newman EV. Effects of xanthine derivatives on lipolysis and on adenosine 3′,5′-monophosphate phosphodiesterase activity. Mol Pharmacol 6: 597–603, 1970 - PubMed
    1. Bieda MC, Copenhagen DR. N-type and L-type calcium channels mediate glycinergic synaptic inputs to retinal ganglion cells of tiger salamanders. Vis Neurosci 21: 545–550, 2004 - PMC - PubMed

Publication types

LinkOut - more resources