

The double-stranded RNA-dependent protein kinase differentially regulates insulin receptor substrates 1 and 2 in HepG2 cells
- PMID: 20685959
- PMCID: PMC2947480
- DOI: 10.1091/mbc.E10-06-0481
The double-stranded RNA-dependent protein kinase differentially regulates insulin receptor substrates 1 and 2 in HepG2 cells
Abstract
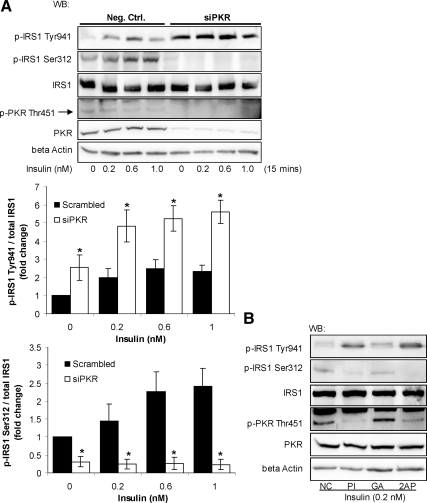
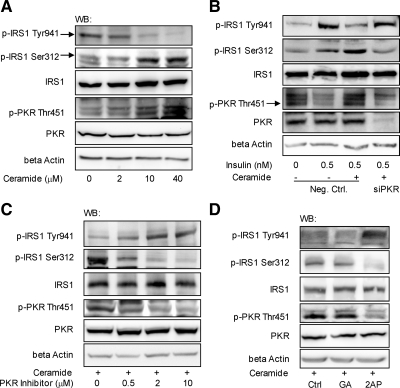
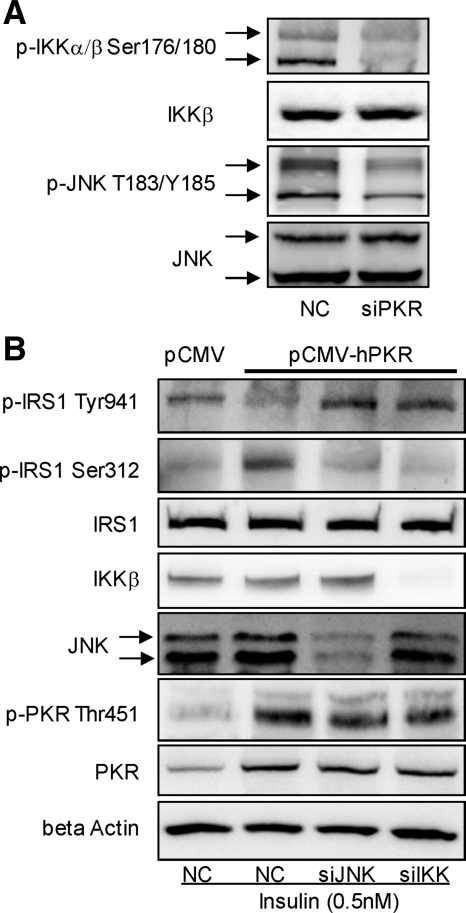
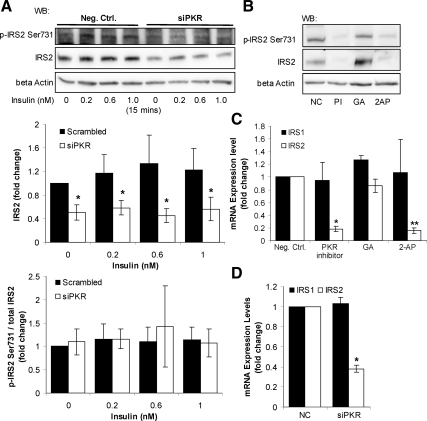
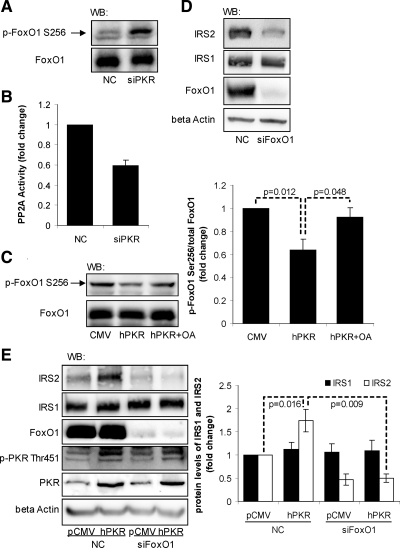
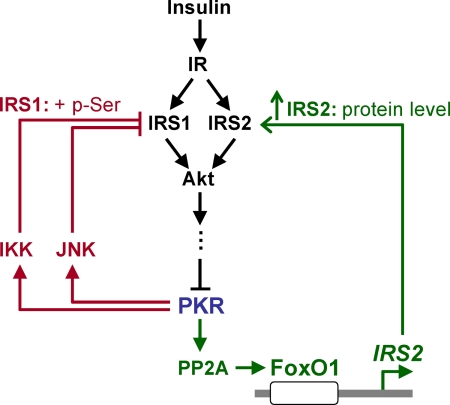
Initially identified to be activated upon virus infection, the double-stranded RNA-dependent protein kinase (PKR) is best known for triggering cell defense responses by phosphorylating eIF-2α, thus suppressing RNA translation. We as well as others showed that the phosphorylation of PKR is down-regulated by insulin. In the present study, we further uncovered a novel function of PKR in regulating the IRS proteins. We found that PKR up-regulates the inhibitory phosphorylation of IRS1 at Ser312, which suppresses the tyrosine phosphorylation of IRS1. This effect of PKR on the phosphorylation of IRS1 is mediated by two other protein kinases, JNK and IKK. In contrast, PKR regulates IRS2, another major IRS family protein in the liver, at the transcriptional rather than the posttranslational level, and this effect is mediated by the transcription factor, FoxO1, which has been previously shown to be regulated by insulin and plays a significant role in glucose homeostasis and energy metabolism. In summary, we found for the first time that initially known as a virus infection response gene, PKR regulates the upstream central transmitters of insulin signaling, IRS1 and IRS2, through different mechanisms.
Figures
Similar articles
-
Sustained Action of Ceramide on the Insulin Signaling Pathway in Muscle Cells: IMPLICATION OF THE DOUBLE-STRANDED RNA-ACTIVATED PROTEIN KINASE.J Biol Chem. 2016 Feb 5;291(6):3019-29. doi: 10.1074/jbc.M115.686949. Epub 2015 Dec 23. J Biol Chem. 2016. PMID: 26698173 Free PMC article.
-
Erythropoietin ameliorates PA-induced insulin resistance through the IRS/AKT/FOXO1 and GSK-3β signaling pathway, and inhibits the inflammatory response in HepG2 cells.Mol Med Rep. 2017 Aug;16(2):2295-2301. doi: 10.3892/mmr.2017.6810. Epub 2017 Jun 20. Mol Med Rep. 2017. PMID: 28656239
-
Double-stranded RNA-activated protein kinase is a key modulator of insulin sensitivity in physiological conditions and in obesity in mice.Endocrinology. 2012 Nov;153(11):5261-74. doi: 10.1210/en.2012-1400. Epub 2012 Sep 4. Endocrinology. 2012. PMID: 22948222
-
Roles of protein kinase R in cancer: Potential as a therapeutic target.Cancer Sci. 2018 Apr;109(4):919-925. doi: 10.1111/cas.13551. Epub 2018 Mar 23. Cancer Sci. 2018. PMID: 29478262 Free PMC article. Review.
-
Activation of the dsRNA-Activated Protein Kinase PKR in Mitochondrial Dysfunction and Inflammatory Stress in Metabolic Syndrome.Curr Pharm Des. 2016;22(18):2697-703. doi: 10.2174/1381612822666160202141845. Curr Pharm Des. 2016. PMID: 26831644 Review.
Cited by
-
Roles of Ceramides in Non-Alcoholic Fatty Liver Disease.J Clin Med. 2021 Feb 16;10(4):792. doi: 10.3390/jcm10040792. J Clin Med. 2021. PMID: 33669443 Free PMC article. Review.
-
Insights into the roles and pathomechanisms of ceramide and sphigosine-1-phosphate in nonalcoholic fatty liver disease.Int J Biol Sci. 2023 Jan 1;19(1):311-330. doi: 10.7150/ijbs.78525. eCollection 2023. Int J Biol Sci. 2023. PMID: 36594091 Free PMC article. Review.
-
Sustained Action of Ceramide on the Insulin Signaling Pathway in Muscle Cells: IMPLICATION OF THE DOUBLE-STRANDED RNA-ACTIVATED PROTEIN KINASE.J Biol Chem. 2016 Feb 5;291(6):3019-29. doi: 10.1074/jbc.M115.686949. Epub 2015 Dec 23. J Biol Chem. 2016. PMID: 26698173 Free PMC article.
-
Kinome Profiling Reveals Abnormal Activity of Kinases in Skeletal Muscle From Adults With Obesity and Insulin Resistance.J Clin Endocrinol Metab. 2020 Mar 1;105(3):644-59. doi: 10.1210/clinem/dgz115. J Clin Endocrinol Metab. 2020. PMID: 31652310 Free PMC article.
-
dsRNA-dependent protein kinase PKR and its role in stress, signaling and HCV infection.Viruses. 2012 Oct 29;4(11):2598-635. doi: 10.3390/v4112598. Viruses. 2012. PMID: 23202496 Free PMC article. Review.
References
-
- Aguirre V., Uchida T., Yenush L., Davis R., White M. F. The c-Jun NH(2)-terminal kinase promotes insulin resistance during association with insulin receptor substrate-1 and phosphorylation of Ser(307) J. Biol. Chem. 2000;275:9047–9054. - PubMed
-
- Alessi D. R., James S. R., Downes C. P., Holmes A. B., Gaffney P. R., Reese C. B., Cohen P. Characterization of a 3-phosphoinositide-dependent protein kinase which phosphorylates and activates protein kinase Balpha. Curr. Biol. 1997;7:261–269. - PubMed
-
- Araki E., Lipes M. A., Patti M. E., Bruning J. C., Haag B., 3rd, Johnson R. S., Kahn C. R. Alternative pathway of insulin signalling in mice with targeted disruption of the IRS-1 gene. Nature. 1994;372:186–190. - PubMed
-
- Aytug S., Reich D., Sapiro L. E., Bernstein D., Begum N. Impaired IRS-1/PI3-kinase signaling in patients with HCV: a mechanism for increased prevalence of type 2 diabetes. Hepatology. 2003;38:1384–1392. - PubMed
-
- Backer J. M., Schroeder G. G., Kahn C. R., Myers M. G., Jr, Wilden P. A., Cahill D. A., White M. F. Insulin stimulation of phosphatidylinositol 3-kinase activity maps to insulin receptor regions required for endogenous substrate phosphorylation. J. Biol. Chem. 1992;267:1367–1374. - PubMed
Publication types
MeSH terms
Substances
Grants and funding
LinkOut - more resources
Full Text Sources
Molecular Biology Databases
Research Materials
Miscellaneous
