. 2010 Aug 4;30(31):10272-81.
doi: 10.1523/JNEUROSCI.1551-10.2010.

SNARE force synchronizes synaptic vesicle fusion and controls the kinetics of quantal synaptic transmission

Affiliations

SNARE force synchronizes synaptic vesicle fusion and controls the kinetics of quantal synaptic transmission

Raul E Guzman et al. J Neurosci. .

Abstract

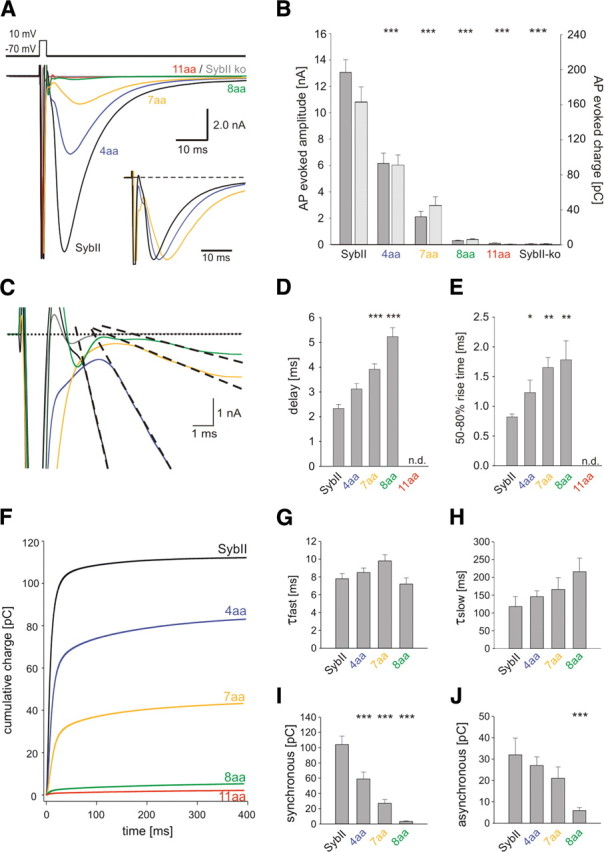
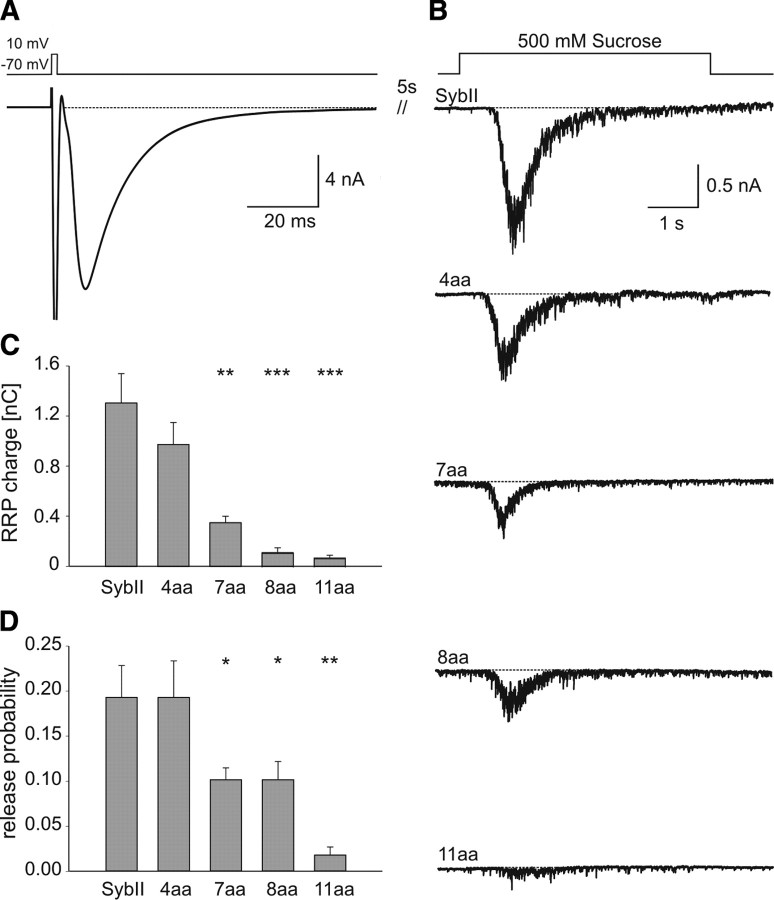
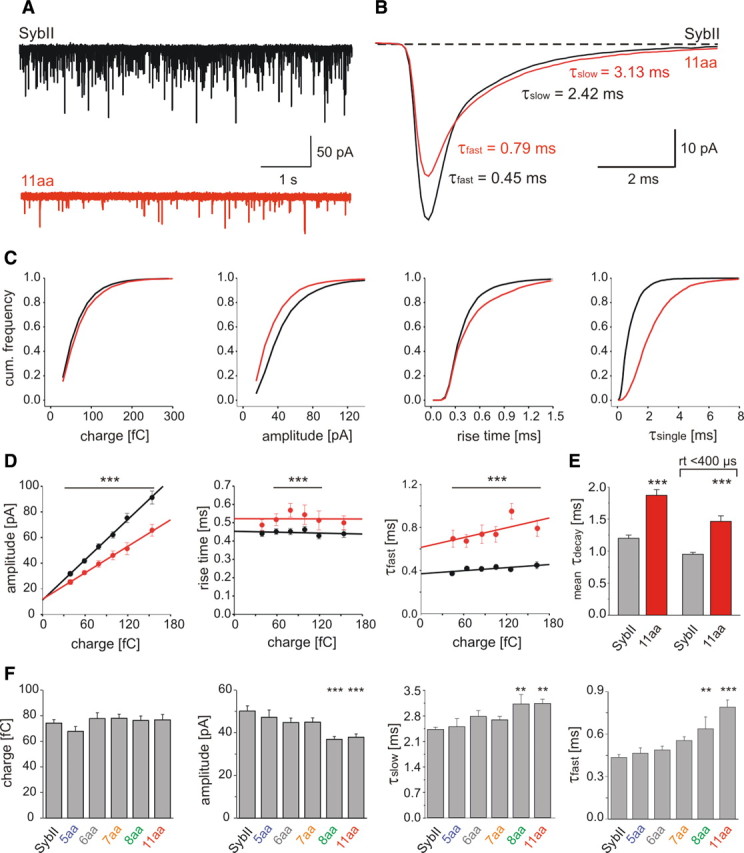
Neuronal communication relies on rapid and discrete intercellular signaling but neither the molecular mechanisms of the exocytotic machinery that define the timing of the action potential-evoked response nor those controlling the kinetics of transmitter release from single synaptic vesicles are known. Here, we investigate how interference with the putative force transduction between the complex-forming SNARE (soluble N-ethylamide-sensitive factor attachment protein receptor) domain and the transmembrane anchor of synaptobrevin II (SybII) affects action potential-evoked currents and spontaneous, quantal transmitter release at mouse hippocampal synapses. The results indicate that SybII-generated membrane stress effectively determines the kinetics of the action potential-evoked response and show that SNARE force modulates the concentration profile of cleft glutamate by controlling the rate of transmitter release from the single synaptic vesicle. Thus, multiple SybII actions determine the exquisite temporal regulation of neuronal signaling.


Figures

Figure 1.
Figure 1.
Extending SybII's juxtamembrane region decreases evoked neurotransmitter release in a linker-length-dependent fashion. A, Averaged EPSCs of hippocampal autaptic neurons mediated by SybII (SybII, n = 16) and its mutant variants (4 aa, n = 20; 7 aa, n = 19; 8 aa, n = 14; 11 aa, n = 10). Amino acid insertions of increasing length gradually decrease the evoked EPSC. The 11 aa insertion was unable to rescue secretion compared with SybII knock-out cells (SybII ko, gray trace). Inset, normalized repsonses. B, Amplitude (dark gray bars) and charge (light gray bars) of the EPSC strongly depend on the length of the linker. C, Representative EPSCs during the first 10 ms after an action potential. Compared with SybII (black), mutant proteins (4 aa, blue; 7 aa, yellow; 8 aa, green) delay the onset of the EPSC defined as the intercept between a linear fit of the EPSC rising phase (dashed lines) and the base line (dotted line). D, Mean synaptic delay measured between the end of the stimulus and the onset of the action potential-evoked EPSC. Note the increase in delay with longer linkers. E, The 50–80% rise time of the EPSC. F, Integral of the averaged EPSC for SybII and its mutant variants. Double exponential fit (data not shown) was used to approximate the data and to distinguish a fast (τfast = 6–10 ms) and a slow (τslow = 100–200 ms) phase of release. G, H, Average τfast and τslow. I, J, Magnitude of the fast and the slow phase of release with increasing linker length (SybII, n = 12; 4 aa, n = 17; 7 aa, n = 15; 8 aa, n = 5). *p < 0.05, **p < 0.01, ***p < 0.001, one-way ANOVA.
Figure 2.
Figure 2.
SybII-mutations do not alter either synapse density or protein expression. A, Representative epifluorescence images of SybII-ko neurons expressing SybII and the 11 aa mutant. Insets show the similar synaptic localization of SybII and the mutant protein at higher magnification. B, Quantification of immunosignals for SybII and its mutants. Mean fluorescence intensity of SybII labeling is nearly identical for the Syb variants and reaches the level of wild-type neurons (n = 25 cells/condition, p = 0.5, one-way ANOVA). No signal is detectable from synaptic varicosities of SybII-ko neurons. C, Synapse density is indistinguishable in SybII and 11 aa mutant cells, as judged from frequency and pattern of synaptophysin-positive puncta. D, Number of synaptophysin-positive puncta determined per 50 μm length of neuronal process is unchanged (n = 25 cells/condition, p = 0.6, one-way ANOVA). Scale bars: A, 50 μm, insets 25 μm; C, 5 μm.
Figure 3.
Figure 3.
The pool of readily releasable vesicles decreases by lengthening the juxtamembrane region of SybII. A, Averaged evoked response of SybII ko autaptic neurons expressing SybII. After 5 s the same cell was stimulated by superfusion with hypertonic solution (see B, top trace). B, Exemplary secretory responses to stimulation with hypertonic solution. The RRP charge is defined by the time integral over the first 1.2 s after the onset of the sucrose response. C, D, Readily releasable pool charge and release probability show a stringent length requirement of SybII‘s juxtamembrane region (SybII, n = 12; 4 aa, n = 20; 7 aa, n = 17; 8 aa, n = 14; 11 aa, n = 10). *p < 0.05, **p < 0.01, ***p < 0.001, one-way ANOVA.
Figure 4.
Figure 4.
Extension of SybII's juxtamembrane region slows quantal signaling. A, Exemplary recordings of mEPSCs activity from ko neurons expressing SybII or the 11 aa mutant (11 aa). B, Ensemble average of mEPSCs from SybII (black, 19 cells, 300–400 events/cell) and the 11 aa mutant (red, 16 cells, 100–130 events/cell). The displayed SSV signals exhibit a similar charge but different amplitudes (SybII: 74 fC, 45 pA, 11 aa: 75 fC, 34 pA). Numbers indicate τdecays. C, Properties of SSV signals mediated by SybII (black, n = 15,293) or 11 aa mutant (red, n = 3829) displayed as cumulative frequency distributions for the indicated parameters. D, Independent of quantal charge, mutant mEPSCs (red) show smaller peak amplitudes, longer 10–90% rise times and τdecays than SybII signals (black). Continuous lines, Linear regressions. Events were grouped according to their charge. Bar indicates statistical differences between groups with identical charge. E, For events with an amplitude >15 pA and those selected with an additional 10–90% rise time restriction (<400 μs), the mean weighted τdecay of mutant signals is ∼1.56-fold and ∼1.54-fold slower than for SybII, respectively. F, Extension of SybII's juxtamembrane region reduces the mEPSC amplitude and progressively prolongs the mEPSC decay without affecting the quantal charge. Values are given as mean ± SEM and data were collected from the following number of cells: SybII (n = 33), 5 aa (n = 13), 6 aa (n = 13), 7 aa (n = 22), 8 aa (n = 31), 11 aa (n = 21). *p < 0.05, **p < 0.01, ***p < 0.001, one-way ANOVA versus SybII.
Figure 5.
Figure 5.
v-SNARE actions controls the glutamate concentration profile in the synaptic cleft. A, Exemplary traces of spontaneous mEPSC mediated by SybII in the absence (black traces; control) and in the presence of 200 μm γ-DGG (red traces). B, γ-DGG causes a reversible attenuation of the mEPSC amplitude. Application of γ-DGG (red bar) is bracketed by control runs with superfusion of Ringer's solution. C, Ensemble average of mEPSCs of cells expressing SybII (left, n = 17) or the 11 aa mutant (right, n = 16) recorded in the absence (black trace) and in the presence of γ-DGG (red trace). Note the different scaling for the left and the right panel. The relative inhibition is stronger for the 11 aa mutant (control: 109 fC, 33 pA, γ-DGG: 75 fC, 25 pA) than for SybII (control: 102 fC, 42 pA, γ-DGG: 82 fC, 35 pA). D, Peak amplitude distributions of mEPSCs in the absence (black) and during exposure of γ-DGG (red) for SybII (left) and the 11 aa insertion (right). Background noise distributions (peak centered at 0 pA) were obtained from 10 to 20 ms of recordings in which no mEPSCs were evident. E, The mEPSC amplitude of 11 aa events is more sensitive to γ-DGG than that of SybII events (SybII, n = 17; 11 aa, n = 16). Top illustrates the reduction in mEPSC frequency caused by γ-DGG. F, Differential effect of γ-DGG on the magnitude of the fast (Af) and slow (As) component of the mEPSC decays measured for SybII and 11 aa signals. G, Mean mEPSC τdecays in the presence and in the absence of γ-DGG for both SybII and 11 aa. The decay time constants, τfastf) and τslows), are significantly slower for mutants signals compared with SybII. *p < 0.05, **p < 0.01, ***p < 0.001, one-way ANOVA.

References

    1. Adler EM, Augustine GJ, Duffy SN, Charlton MP. Alien intracellular calcium chelators attenuate neurotransmitter release at the squid giant synapse. J Neurosci. 1991;11:1496–1507. - PMC - PubMed
    1. Bekkers JM, Stevens CF. Excitatory and inhibitory autaptic currents in isolated hippocampal neurons maintained in cell culture. Proc Natl Acad Sci U S A. 1991;88:7834–7838. - PMC - PubMed
    1. Bekkers JM, Richerson GB, Stevens CF. Origin of variability in quantal size in cultured hippocampal neurons and hippocampal slices. Proc Natl Acad Sci U S A. 1990;87:5359–5362. - PMC - PubMed
    1. Bollmann JH, Sakmann B. Control of synaptic strength and timing by the release-site Ca2+ signal. Nat Neurosci. 2005;8:426–434. - PubMed
    1. Bollmann JH, Sakmann B, Borst JG. Calcium sensitivity of glutamate release in a calyx-type terminal. Science. 2000;289:953–957. - PubMed

Publication types

MeSH terms

Substances