. 2010 Aug 4;30(31):10306-23.
doi: 10.1523/JNEUROSCI.2023-10.2010.

Functional magnetic resonance imaging reveals the neural substrates of arm transport and grip formation in reach-to-grasp actions in humans

Affiliations

Functional magnetic resonance imaging reveals the neural substrates of arm transport and grip formation in reach-to-grasp actions in humans

Cristiana Cavina-Pratesi et al. J Neurosci. .

Abstract

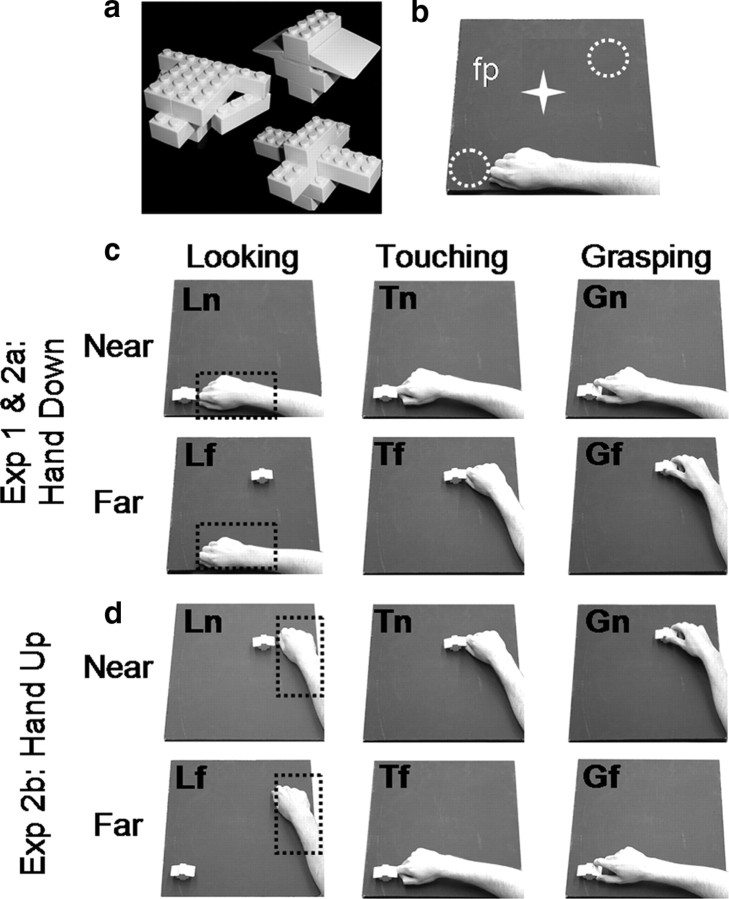
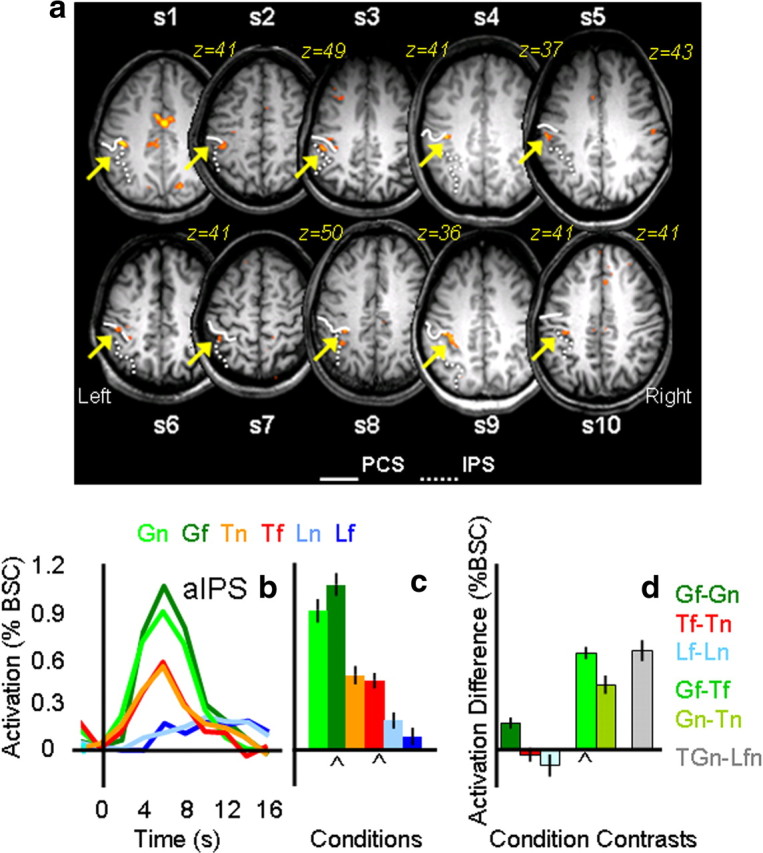
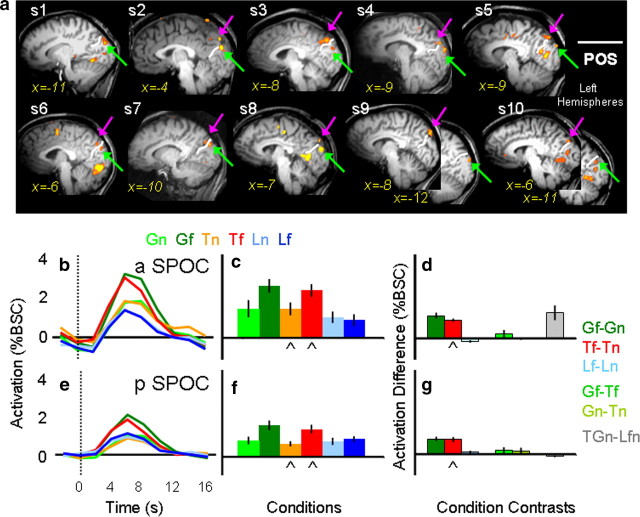
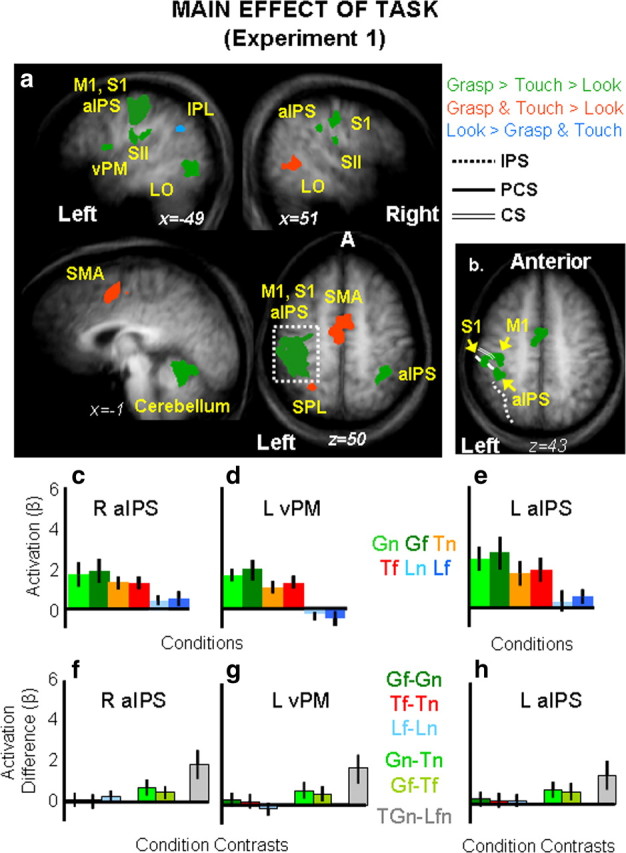
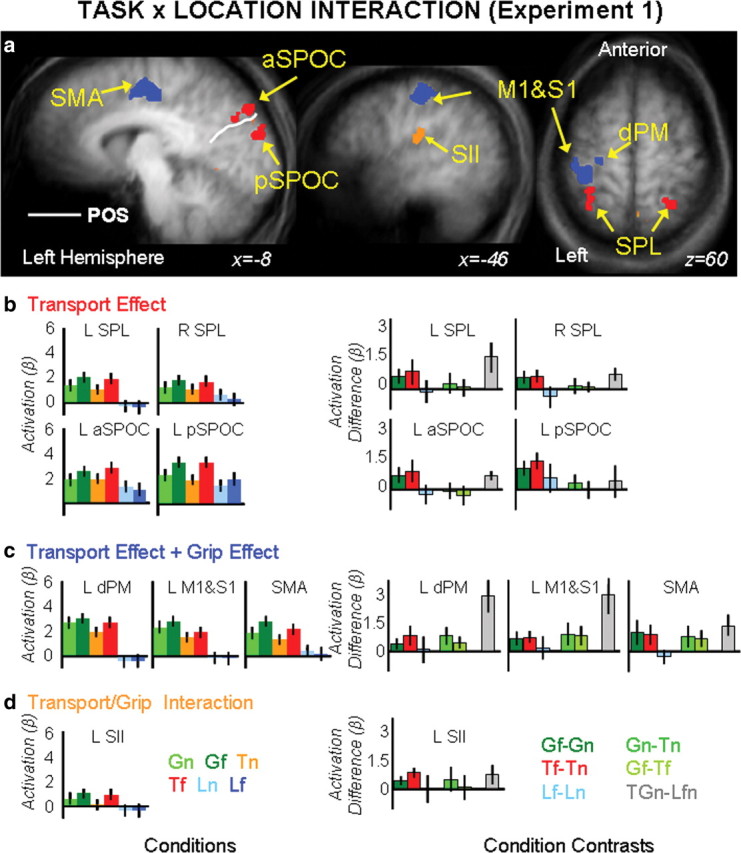
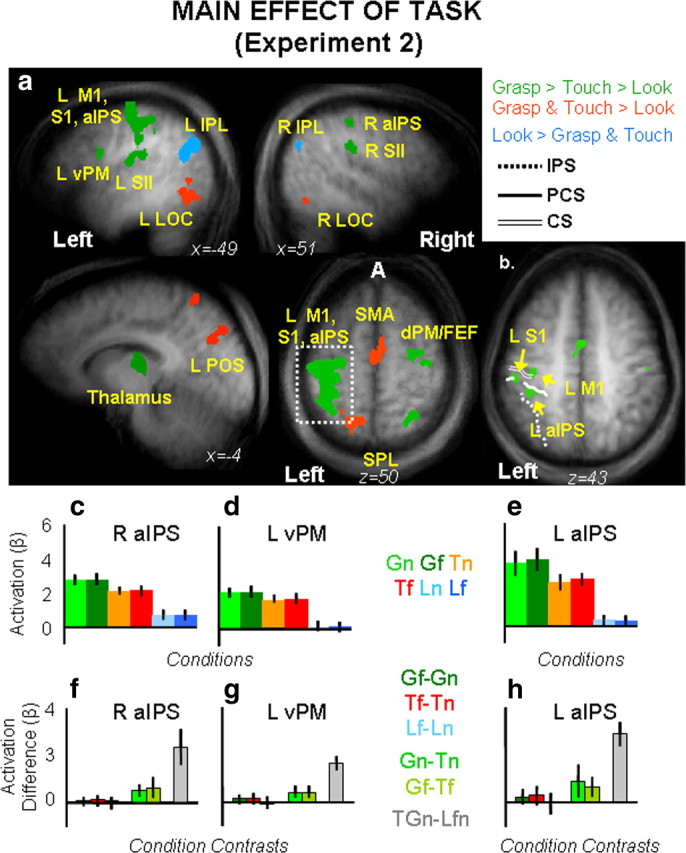
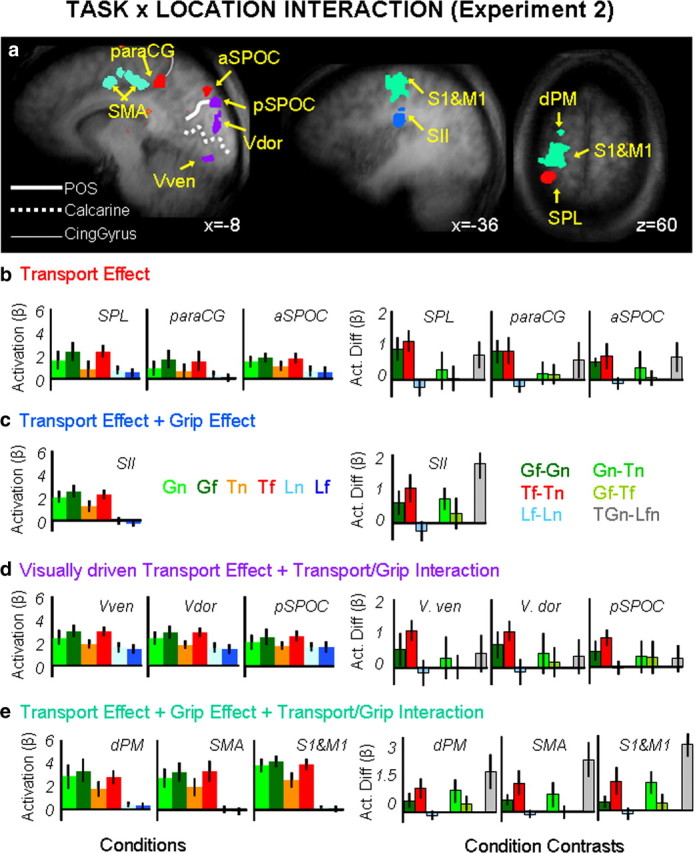
Picking up a cup requires transporting the arm to the cup (transport component) and preshaping the hand appropriately to grasp the handle (grip component). Here, we used functional magnetic resonance imaging to examine the human neural substrates of the transport component and its relationship with the grip component. Participants were shown three-dimensional objects placed either at a near location, adjacent to the hand, or at a far location, within reach but not adjacent to the hand. Participants performed three tasks at each location as follows: (1) touching the object with the knuckles of the right hand; (2) grasping the object with the right hand; or (3) passively viewing the object. The transport component was manipulated by positioning the object in the far versus the near location. The grip component was manipulated by asking participants to grasp the object versus touching it. For the first time, we have identified the neural substrates of the transport component, which include the superior parieto-occipital cortex and the rostral superior parietal lobule. Consistent with past studies, we found specialization for the grip component in bilateral anterior intraparietal sulcus and left ventral premotor cortex; now, however, we also find activity for the grasp even when no transport is involved. In addition to finding areas specialized for the transport and grip components in parietal cortex, we found an integration of the two components in dorsal premotor cortex and supplementary motor areas, two regions that may be important for the coordination of reach and grasp.


Figures

Figure 1.
Figure 1.
Schematic illustration of the stimuli and setup used for experiments 1 and 2. a, Stimuli were Lego pieces assembled to create ∼10 different novel 3D objects. b, The setup required participants gaze at the fixation point (fp) while performing the tasks at two possible object locations: near and far from the hand (white dotted circles). The white star represents the fixation point, which was located midway between the two objects. c, d, For both experiments, the setup is illustrated from the point of view of the participants. The starting positions of the hand are highlighted by black dotted rectangles. In experiment 1, only one starting position was used (c). In experiment 2, two starting positions were used (c, d). At trial onset, participants were asked to perform one of the following tasks: (1) looking (left column): passively viewing the objects; (2) touching (middle column): touching the object with the knuckles; or (3) grasping (right column): using a precision grip (with the index finger and the thumb) to grasp and lift the object. Actions performed at the location furthest from the starting position required arm transport. The hand down starting position (c) involved a rotation of the elbow to extend (abduct) the arm while keeping the palm down (pronated). The hand up starting position (d) involved a rotation of the elbow to flex (adduct) the arm while keeping the palm down (pronated). Grasping at the near locations required hand displacement but no arm transport. Overall there were six actions: Gf, grasping the far object; Tf, touching the far object; Lf, passive viewing of the far object; Gn, grasping the near object; Tn, touching the near object; Ln, passive viewing of the near object.
Figure 2.
Figure 2.
Individual statistical maps and activation levels across conditions for the aIPS region of interest in experiment 1. a, The position of the left aIPS, localized by comparing Gf versus Tf, is shown in the most clear transverse slice (z value) for each of the 10 participants. In each participant, aIPS (highlighted by a yellow arrow) was identified at the junction of the anterior end of the intraparietal sulcus (dotted line) and the inferior segment of the PCS (solid line). b, Line graphs show the event-related average time courses for the six experimental conditions in the left aIPS with time 0 indicating the onset of the visual stimuli. c, The bar graph displays the average magnitude of peak activation (%BSC) in each experimental condition for the group. d, The bar graph displays differences in average peak activations (%BSC) between key conditions. Error bars represent 95% confidence intervals such that difference scores with error bars that do not include zero indicate that the difference was significant at p < 0.05, two-tailed t test. The chevron (⋀) highlights the experimental conditions and contrast used to localize each ROI, indicating which conditions and contrasts may be susceptible to the nonindependence error. Statistical values for the %BSC peak activation differences are as follows: Gf > Gn, p = 0.0005; Tf = Tn, p = 0.2; Lf = Ln, p = 0.09; Gf > Tf, p = 0.0001; Gn > Tn, p = 0.0001; GTn > Lnf, p = 0.0001.
Figure 3.
Figure 3.
Individual statistical maps and activation levels across conditions for the anterior and posterior superior parietal occipital sulcus (SPOC) regions of interest in experiment 1. a, The positions of aSPOC and pSPOC, localized by comparing Tf versus Tn, are shown in the most clear sagittal slice (x value) within the left hemisphere for each of the 10 participants. In all 10 participants, posterior SPOC (highlighted by a green arrow) was identified posterior to the POS. In 9 of the 10 participants, activation in the anterior SPOC (highlighted by a pink arrow) was identified anterior to the POS. b, e, Line graphs indicate the event-related average time courses for the six experimental conditions in the anterior and posterior SPOC, with time 0 indicating the onset of the visual stimuli. c, f, The bar graphs display the average magnitude of peak activation in %BSC in each experimental condition for the group. d, g, The bar graphs display differences in the average peak activation (%BSC) between key comparisons. Conventions are as in Figure 2. Statistical values for the %BSC peak activation differences are as follows: a SPOC: Gf > Gn, p = 0.0001; Tf = Tn, p = 0.0001; Lf = Ln, p = 0.054; Gf > Tf, p = 0.085; Gn > Tn, p = 0.45; GTn > Lnf, p = 0.0053; pSPOC: Gf > Gn, p = 0.0001; Tf = Tn, p = 0.0001; Lf = Ln, p = 0.117; Gf > Tf, p = 0.083; Gn > Tn, p = 0.074; GTn > Lnf, p = 0.02.
Figure 4.
Figure 4.
Group statistical maps and activation levels for areas showing a main effect of task in experiment 1. a, Each region that showed a significant main effect of task in the voxelwise ANOVA for experiment 1 is color coded based on the pattern of activation, as indicated in the legend. The group activation map is based on the Talairach averaged group results shown on the averaged anatomical map. Talairach coordinates for the activated areas and p values for the relevant statistical comparisons are shown in Table 1. b, Brain areas surviving a more conservative threshold (p < 0.0001, Bonferroni corrected) for the same main effect of task revealed distinct foci of activation within left M1, left S1, and left aIPS. ch, The bar graphs display average and differences for β weights within key areas in the grasping network: right aIPS (c, f), left vPM (d, g) and left aIPS (e, h). Statistical values for the β weight differences in left vPM, left aIPS, and right aIPS are as follows: Left vPM: Gf = Gn, p = 0.67; Tf = Tn, p = 0.31; Lf = Ln, p = 0.42; Gf > Tf, p = 0.007; Gn > Tn, p = 0.004; GTn > Lnf, p = 0.0001; left aIPS: Gf = Gn, p = 0.146; Tf = Tn, p = 0.185; Lf = Ln, p = 0.134; Gf > Tf, p = 0.0018l Gn > Tn, p = 0.005; GTn > Lnf, p = 0.0008; right aIPS: Gf = Gn, p = 0.53; Tf = Tn, p = 0.3; Lf = Ln, p = 0.55; Gf > Tf, p = 0.003; Gn > Tn, p = 0.003, GTn > Lnf, p = 0.0001. aIPS, Anterior intraparietal sulcus; CS, central sulcus; IPL, inferior parietal lobe; IPS, intraparietal sulcus; L, left; LOC, lateral occipital complex; M1, primary motor cortex; PCS, postcentral sulcus; R, right; S1, primary somatosensory cortex; SII (S2), secondary somatosensory area; SMA, supplementary motor area; SPL, superior parietal lobe; vPM, ventral premotor cortex.
Figure 5.
Figure 5.
Group statistical maps and activation levels for areas showing an interaction of task × location in experiment 1. a, Each region that showed a significant interaction of task × location in the voxelwise ANOVA is color-coded based on the pattern of activations, as indicated by the color coded headers for b, c, and d. bd, Bar graphs show β weight averages (left panels) and β weight differences between key conditions (right panels) for each area. Labels and conventions are as in previous figures. dPM, Dorsolateral premotor cortex.
Figure 6.
Figure 6.
Group statistical maps and activation levels for areas showing a main effect of task in experiment 2. a, Each region that showed a significant main effect of task in the voxelwise ANOVA for experiment 2 is color coded based on its pattern of activations, as indicated in the legend. Talairach coordinates for the activated areas and p values for the relevant statistical comparisons are shown in Table 3. b, Brain areas that survived a more conservative threshold (p < 0.0001, Bonferroni corrected) for the same main effect of task revealed separate activations within left M1, left S1, and left aIPS. ch, The bar graphs display average and differences for β weights in each experimental condition within key areas in the grasping network: right aIPS (c, f), left vPM (d, g), and left aIPS (e, h). Labels and conventions are as in previous figures. β weight differences in left vPM, left aIPS, and right aIPS are as follows: Left vPM: Gf = Gn, p = 0.75; Tf = Tn, p = 0.71; Lf = Ln, p = 0.43; Gf > Tf, p = 0.009; Gn > Tn, p = 0.007; GTn > Lnf, p = 0.0001; left aIPS: Gf > Gn, p = 0.094; Tf = Tn, p = 0.103; Lf = Ln, p = 0.409; Gf > Tf, p = 0.007; G > Tn, p = 0.003; GTn > Lnf, p = 0.0001; right aIPS: Gf = Gn, p = 0.73; Tf = Tn, p = 0.43; Lf = Ln, p = 0.65; Gf > Tf, p = 0.0003; Gn > Tn, p = 0.0031; GTn > Lnf, p = 0.0001.
Figure 7.
Figure 7.
Group statistical maps and activation levels for areas showing an interaction of task × location in experiment 2. a, Brain areas are depicted according to the specific pattern of activation they displayed as indicated by color labels for b, c, d, and e. The group activation map is based on the Talairach averaged group results shown on one averaged anatomical map. be, Bar graphs show averaged β weights (left panels) and differences in β weights between key conditions (right panels) for the transport effect-related areas (b), the transport effect plus grip effect related areas (c), the visually driven transport effect related areas (d), and the transport effect-, grip effect-, and transport/grip interaction effect-related areas (e). Labels and conventions as in previous figures. Vven, visual ventral; Vdor, visual dorsal.

References

    1. Andersen RA, Buneo CA. Intentional maps in posterior parietal cortex. Annu Rev Neurosci. 2002;25:189–220. - PubMed
    1. Arbib MA. Perceptual structures and distributed motor control. In: Brooks VB, editor. Handbook of physiology. Bethesda, MD: American Physiological Society; 1981. pp. 1449–1480.
    1. Battaglini PP, Muzur A, Galletti C, Skrap M, Brovelli A, Fattori P. Effects of lesions to area V6A in monkeys. Exp Brain Res. 2002;144:419–422. - PubMed
    1. Begliomini C, Wall MB, Smith AT, Castiello U. Differential cortical activity for precision and whole-hand visually guided grasping in humans. Eur J Neurosci. 2007a;25:1245–1252. - PubMed
    1. Begliomini C, Caria A, Grodd W, Castiello U. Comparing natural and constrained movements: new insights into the visuomotor control of grasping. PLoS One. 2007b;2:e1108. - PMC - PubMed

Publication types

LinkOut - more resources