. 2010 Aug 4;30(31):10324-36.
doi: 10.1523/JNEUROSCI.1208-10.2010.

Long and short multifunicular projections of sacral neurons are activated by sensory input to produce locomotor activity in the absence of supraspinal control

Affiliations

Long and short multifunicular projections of sacral neurons are activated by sensory input to produce locomotor activity in the absence of supraspinal control

Alex Etlin et al. J Neurosci. .

Abstract

Afferent input from load and joint receptors has been shown to reactivate the central pattern generators for locomotion (CPGs) in spinal cord injury patients and thereby improve their motor function and mobility. Elucidation of the pathways interposed between the afferents and CPGs is critical for the determination of the capacity of sensory input to activate the CPGs when the continuity of the white matter tracts is impaired following spinal cord injury. Using electrophysiological recordings, confocal imaging studies of spinal neurons and surgical manipulations of the white matter, we show that the capacity of sacrocaudal afferent (SCA) input to produce locomotor activity in isolated rat spinal cords depends not only on long ascending pathways, but also on recruitment of sacral proprioneurons interposed between the second order neurons and the hindlimb CPGs. We argue that large heterogeneous populations of second-order and proprioneurons whose crossed and uncrossed axons project rostrally through the ventral, ventrolateral/lateral and dorsolateral white matter funiculi contribute to the generation of the rhythm by the stimulated sacrocaudal input. The complex organization and multiple projection patterns of these populations enable the sacrocaudal afferent input to activate the CPGs even if the white matter pathways are severely damaged. Further studies are required to clarify the mechanisms involved in SCA-induced locomotor activity and assess its potential use for the rescue of lost motor functions after spinal cord injury.


Figures
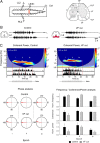
Figure 1.
Figure 1.
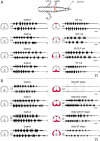
Wavelet analysis of rhythmic bursts produced in the lumbar segments of the spinal cord by stimulation of sacrocaudal afferents. A, Schematic illustration of the preparation and the surgical manipulations whose effects on the rhythm are analyzed. The isolated spinal cord preparation of the neonatal rat is shown in the experimental bath (frame). The rhythm is produced by stimulation of the Co1 dorsal root (Co1) and recorded from the left and right L2 ventral roots (LL2 and RL2 respectively). The lumbosacral junction at which the ventral funiculi were lesioned (scissors) is denoted by the red bar. The cross section of the spinal cord on the right shows the gray matter laminae (I–X) and the white matter funiculi. DF, DLF, LF, VLF and VF are the dorsal, dorsolateral, lateral, ventrolateral and ventral funiculi, respectively. B, Recordings of the rhythm produced by SCA stimulation from the left (L) and right (R) ventral roots of L2 before (Control), and following a bilateral VF cut (VF cut) at the lumbosacral junction. The lesioned funiculi are shown in red at the schematic cross section. C, The coherent power spectra of the rhythm before and after the bilateral VF lesion (Control and VF cut) are superimposed with the respective rectified data. The high-power regions of interest (ROIs) selected for further analysis are delineated with the white dotted lines, and the 3 consecutive epochs composing each ROI (I, II, and III) are marked by red lines. The stimulus trains are illustrated below each spectrum (trains). Circular plots of the mean left–right phase values and r-vectors (red arrows) at each of the three epochs within each ROI are shown on the lower left (Phase analysis, control and VF cut). The mean normalized frequency, coherence and normalized power during each epoch, before (black bars), and after (gray bars) the bilateral VF cut are superimposed with the respective SD on the lower right (Frequency/Coherence/Power analysis). Stimulus trains, Control and VF cut: 20 pulse, 1.3 Hz at 1.1T. Number of trains: 4 Control, 4 VF cut.
Figure 2.
Figure 2.
Effects of funicular lesions on the lumbar rhythm produced by SCA stimulation. A, Recordings from the left and right L2 ventral root in 4 different experiments during stimulation of the Co1 dorsal root before (Control), and after bilateral interruption of the DF (DF cut), DLF (DLF cut), VLF/LF (VLF/LF cut) and VF (VF cut). The lesioned funiculi are shown in red in the schematic cross sections (left to each set of traces). Stimulus trains (control and the respective postlesion recordings), DF cut: 60 pulse, 4 Hz, 1.7T; DLF cut: 50 pulse, 3.3 Hz, 1.2T; VLF/LF cut: 50 pulse, 4 Hz, 1.25T; VF cut: 20 pulse, 1.3 Hz at 1.1T Note that the VLF lesions included the LF. Therefore these lesions are referred to as VLF/LF lesions throughout the present study. B, Recordings from the left and right L2 ventral root in 4 different experiments during stimulation of the Co1 dorsal root before (Control), and after bilateral interruption of the VF, VLF/LF and DLF (only DF intact), the VF, VLF/LF and DF (only DLF intact), the VF, DLF and DF (only VLF/LF intact) and the VLF/LF, DLF and DF (only VF intact). The lesioned funiculi are shown in red in the schematic cross sections (left to each set of traces). Stimulus trains: only DF intact: 50 pulse, 4 Hz, 1.7T (control) and 8.3T (postlesion); only DLF intact 40 and 50 pulse (control and postlesions), 3.3 Hz, 1.9T; only VLF/LF intact: 20 pulse, 1.3 Hz, 1.1T (control), 30 pulse 2 Hz, 1.9T (postlesions); only VF intact: 30 pulse, 2 Hz, 1.2T. Calibration bars (A, B), 2 s.
Figure 3.
Figure 3.
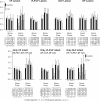
Effects of funicular lesions on the frequency and power of the lumbar rhythm produced by SCA stimulation. The means ± SDs of the normalized frequency and power (norm. freq., norm. power) of the rhythm produced by SCA stimulation and recorded from the left and right ventral roots of L2 before (Control, black histograms) and after surgical manipulations of the white matter funiculi (Cut, white histograms) are shown for the three epochs sampled during the stimulus trains (epochs I, II, and III are numbered 1, 2, 3 for the Control and a–c for the postlesion period, respectively). The matrices below each set of histograms show the results of the multiple-comparison tests performed using the modified Tukey's method. Significant differences (starting from p < 0.05) are denoted by X. The number of experiments was as follows: VF lesion = 9, VLF/LF lesion = 4, DLF lesion = 4, DF lesion = 4, Only VF intact = 3, Only VLF/LF intact = 6, only DLF intact = 4, only DF intact (data not shown) = 5. The number of trains in each experiment was 8 (4 control, and 4 postlesion trains).
Figure 4.
Figure 4.
Activation of nonsegmental sacral relay neurons by SCA stimulation through the sacral dorsal columns. Recordings from the left and right L2 ventral roots in one of the experiments during stimulation of the Co2, Co1, S4 and S3 dorsal roots respectively, before (Control), and after a bilateral lesion that interrupted the VF, VLF/LF and DLF at S2/S3 border and left the DF as the only bilaterally intact funiculus. Stimulus trains, S3: 40 pulse 3 Hz, 1.9T (control), 60 pulse 4 Hz, 1.25T (postlesions); S4: 50 pulse 3 Hz, 2T (control), 40 pulse 3 Hz, 1.3T (postlesions); Co1: 40 and 50 pulse (control and postlesions), 3 Hz, 1.25T; Co2: 50 pulse, 4 Hz, 2.5T (control and postlesions).
Figure 5.
Figure 5.
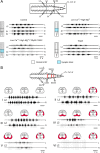
The involvement of sacral neurons with long and short ascending projections in the generation of the lumbar rhythm by SCA stimulation. A, The SCA-induced rhythm can be produced by activation of sacral neurons with long ascending projections. Schematic illustration of the experimental setting is shown on top. The preparation is mounted with ventral side up in an experimental bath that was divided into a rostral (T6 to caudal L2), middle (caudal L2 to rostral S2), and a caudal (rostral S2 to Co3) compartments, by Vaseline wall. The rhythm was produced by stimulation of the Co1 dorsal root and recordings were obtained from the left and right L2 ventral roots, and from the right S1 and S2 ventral roots. The rhythm was produced by stimulation of the Co1 dorsal root before (Control), after blocking the synaptic transmission from caudal L2 to rostral S2 by changing the bathing medium in the middle chamber from ACSF to low Ca+2/high Mg+2 ACSF (Low Ca+2/high Mg+2) and then adding 20 μm CNQX (Low Ca+2/High Mg+2/20 μm CNQX). Recordings were also obtained after alleviation of the block following 30 min wash (Wash). Stimulus trains: 50 pulse, 4 Hz, 2.4T. B, The lumbar CPGs can be activated by SCA stimulation when the direct contacts made by long-ascending axons from the sacral neurons are interrupted. The scheme on top shows the preparation and the experimental paradigm that was used in this series. The rhythm was produced by stimulation of the Co1 dorsal root and recorded from the left and right L2 ventral root. The preparation was surgically manipulated at three segmental levels S3/S4, S2/S3 and L6/S1 (red bars in the top, and red fills in the schematic cross sections above each set of traces). The rhythm is shown before (I), after cutting the VLF/LF, DLF and DF at the S3/S4 border and leaving the VF as the only intact funiculi (II), after bilateral interruption of the VF at the S2/S3 (III) and L6/S1 level (IV), extension of this latter lesion to the VLF/LF (V) and DLF (VI). Stimulus trains: 50 (I, III, V) and 60 (II, II) pulse at 4 Hz,1.75T; 40 pulse, 3 Hz at 2.5T (VI).
Figure 6.
Figure 6.
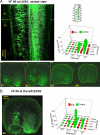
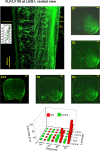
Rostrally projecting VF neurons. A, Schematic ventral view of backfilling of cut VF axon bundles with fluorescein dextran at the left lumbosacral junction is shown on the right. A projected confocal image of sacral neurons labeled through the cut VF axons at the left lumbosacral junction in a whole mount transparent preparation of the spinal cord. This image is composed of a sample of 20 consecutive optical slices, 8 μm each, scanned from the ventral aspect of the whole mount preparation. Projected confocal images of 70-μm-thick cross sections through the S1, S2, S3 and S4 of a different preparation are superimposed below. Calibration bars: 100 μm; the perimeter of the cross sections and the central canal are delineated by dashed lines. Note the predominance of contralaterally filled neurons, the decrease in the number of cells in the caudal direction and, the course of the crossing axons onto the ascending VF. The three dimensional histogram on the right shows the mean segmental and laminar distribution of contra (green) and ipsilaterally (red) labeled neurons in the 12 labeling experiments performed in this series. s- and d-Dorsal, Superficial (laminae I–IV) and deep (laminae V and VI) dorsal laminae; respectively; CC, laminae X neurons around the central canal; Inter., lamina VII; Ventral, laminae VIII and IX. B, Confocal projected image of cross section through the S4 segment following retrograde VF labeling with fluorescein dextran loaded via the cut VF at the S2/S3 junction. The segmental and laminar distribution of the labeled neurons in 3 experiments is shown in a 3D histogram on the left. Note that neurons were labeled in S3–Co2 mainly contralateral to the fill. The projected image is composed of 10 optical slices, 8 μm each. For abbreviations, see Fig. 6A.
Figure 7.
Figure 7.
Rostrally projecting VLF/LF neurons. Schematic ventral view of backfilling of cut VLF axon bundles with fluorescein dextran at the left lumbosacral junction is superimposed with a projected confocal image (40 of 65 optical slices, 8 μm each) of sacral neurons labeled through the cut VLF axons at the left lumbosacral junction in a whole mount transparent preparation of the spinal cord. Projected confocal images of 70-μm-thick cross sections through the S1, S2, S3, S4 and Co1 in one of the five labeling experiments performed in this series are shown to the right and below the image of the whole mount preparation. Calibration bars: 100 μm. The 3D histogram below shows the segmental and laminar distribution of the labeled VLF neurons. The numbers of neurons are means of five labeling experiments. For abbreviations, see Fig. 6A.
Figure 8.
Figure 8.
Retrograde labeling of DLF neurons. Schematic dorsal view of retrograde labeling of Cut DLF axon bundles at the rostral S1 level are superimposed with the rostral face of a projected confocal image of a cross section cut through the S2 segment (the image consists of 2/8, 8 μm optical slices). The rectangular region delineated by dashed line in the upper cross sections is enlarged on the lower left panel to show more details of some of the labeled neurons. The 3D histogram on the lower right shows the segmental and laminar distribution of the labeled DLF neurons. The numbers of neurons are means of 11 labeling experiments. Calibration bars, 100 μm.
Figure 9.
Figure 9.
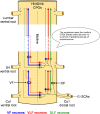
The pathways involved in activation of the hindlimb CPGs by SCA stimulation. Schematic ventral view of the spinal cord illustrates the suggested functional organization of the pathways activated by SCA stimulation to produce rhythmic activity in the limb innervating segments of the spinal cord. Sacrocaudal afferents (SCAs) entering the spinal cord through the sacral dorsal roots (Co1 in this example) activate segmental sacral neurons that project rostrally via the VF (blue), VLF (red) and DLF (green) as demonstrated in our lesion experiments (Figs. 2 and 3). Nonsegmental sacral neurons (S4 in this example) with similar projection pattern are activated by the Co1 afferents ascending within the sacral dorsal funiculus (DF), as demonstrated in the experiment shown in Figure 4. The proportions of crossed and uncrossed projections through each funiculus (based on the labeling studies shown in Figs. 6–8) are denoted by the thickness of the illustrated pathways. Thus, the VF projections are mainly crossed and the VLF and DLF are mainly uncrossed. Some of the crossed VLF projections join the VLF after traveling through part of the sacral VF as demonstrated in Figure 7. The axons of the activated sacral neurons reach the hindlimb pattern generators either directly (see Fig. 5A) or/and by chain recruitment of groups of proprioneurons (see Fig. 5B). Projections of VF neurons can activate other groups of VF, as well as VLF and DLF proprioneurons (see Fig. 5B and text).

Similar articles

Cited by

References

    1. Arsénio Nunes ML, Sotelo C. Development of the spinocerebellar system in the postnatal rat. J Comp Neurol. 1985;237:291–306. - PubMed
    1. Baldissera F, Hultborn H, Illert M. Integration in spinal neuronal systems. In: Brooks VB, editor. Handbook of Physiology. Bethesda, MD: American Physiological Society; 1981. pp. 509–595.
    1. Bizzi E, Cheung VC, d'Avella A, Saltiel P, Tresch M. Combining modules for movement. Brain Res Rev. 2008;57:125–133. - PMC - PubMed
    1. Blivis D, Mentis GZ, O'Donovan MJ, Lev-Tov A. Differential effects of opioids on sacrocaudal afferent pathways and central pattern generators in the neonatal rat spinal cord. J Neurophysiol. 2007;97:2875–2886. - PubMed
    1. Blivis D, Mentis GZ, O'Donovan MJ, Lev-Tov A. Studies of sacral neurons involved in activation of the lumbar central pattern generator for locomotion in the neonatal rodent spinal cord. Soc Neurosci Abstr. 2009;35:564–8.

Publication types

LinkOut - more resources