. 2010 Aug 4;30(31):10448-59.
doi: 10.1523/JNEUROSCI.1624-10.2010.

Selection of prime actor in humans during bimanual object manipulation

Affiliations

Selection of prime actor in humans during bimanual object manipulation

Anna Theorin et al. J Neurosci. .

Abstract

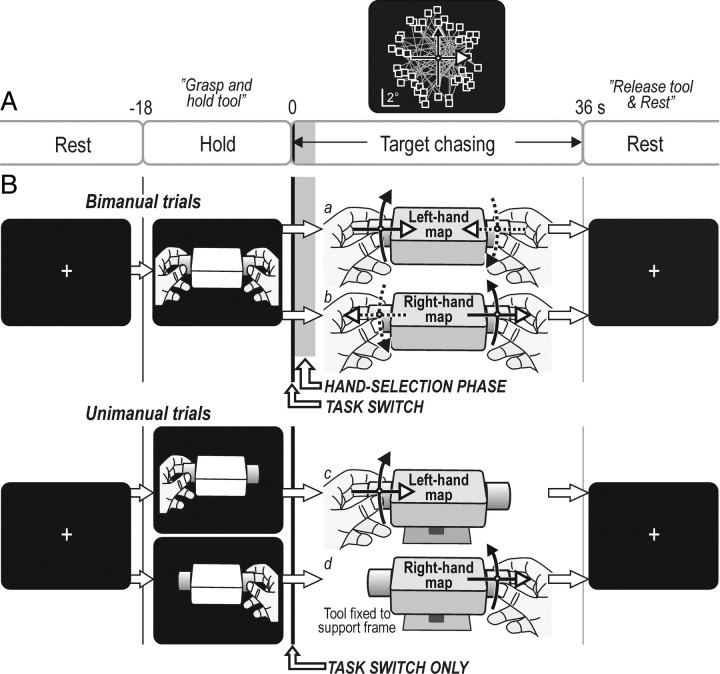
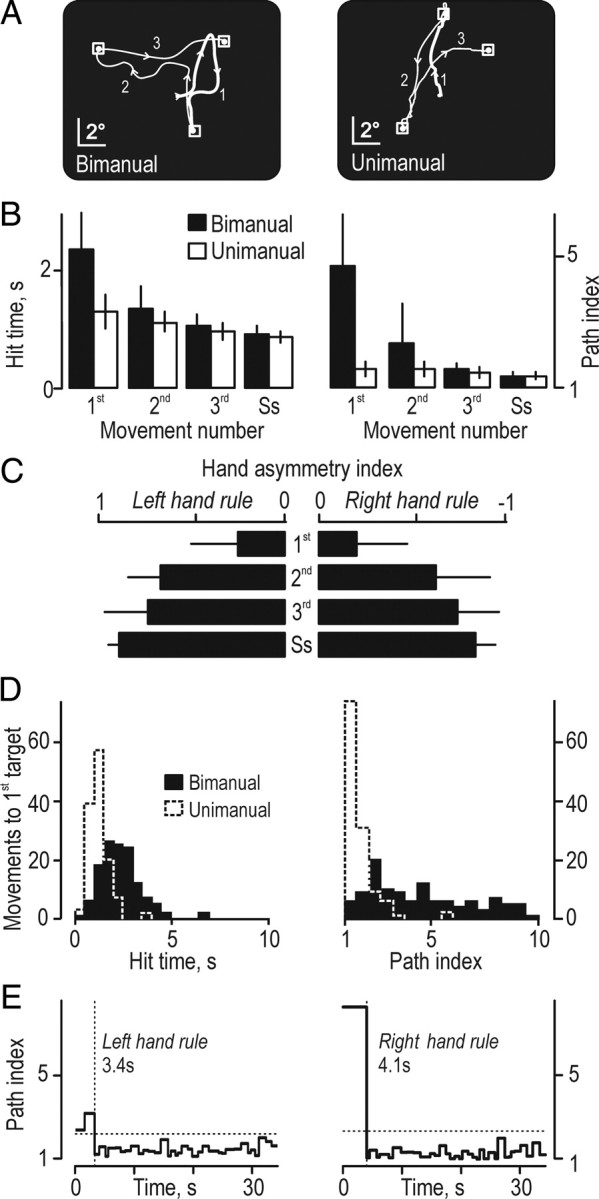
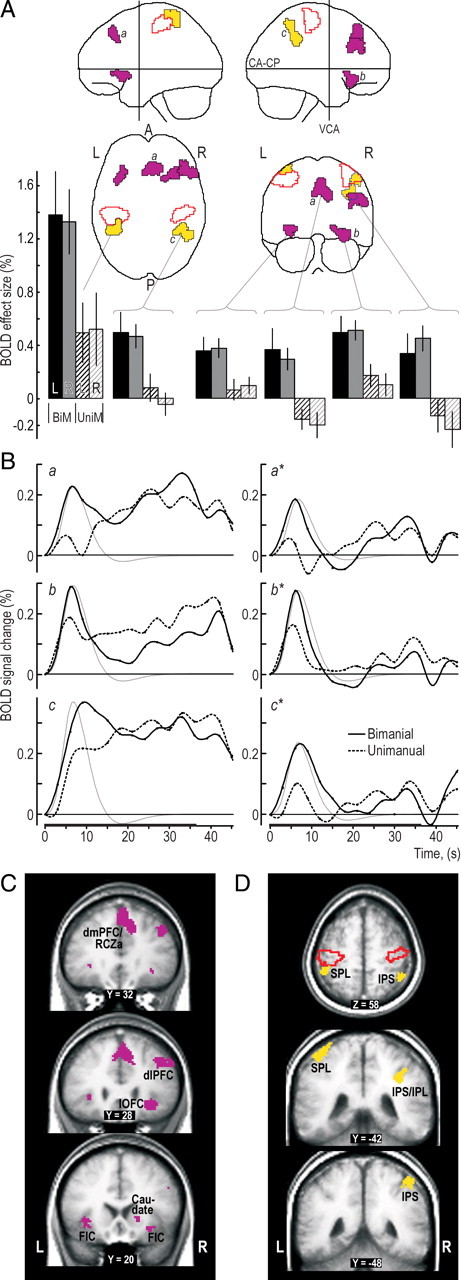
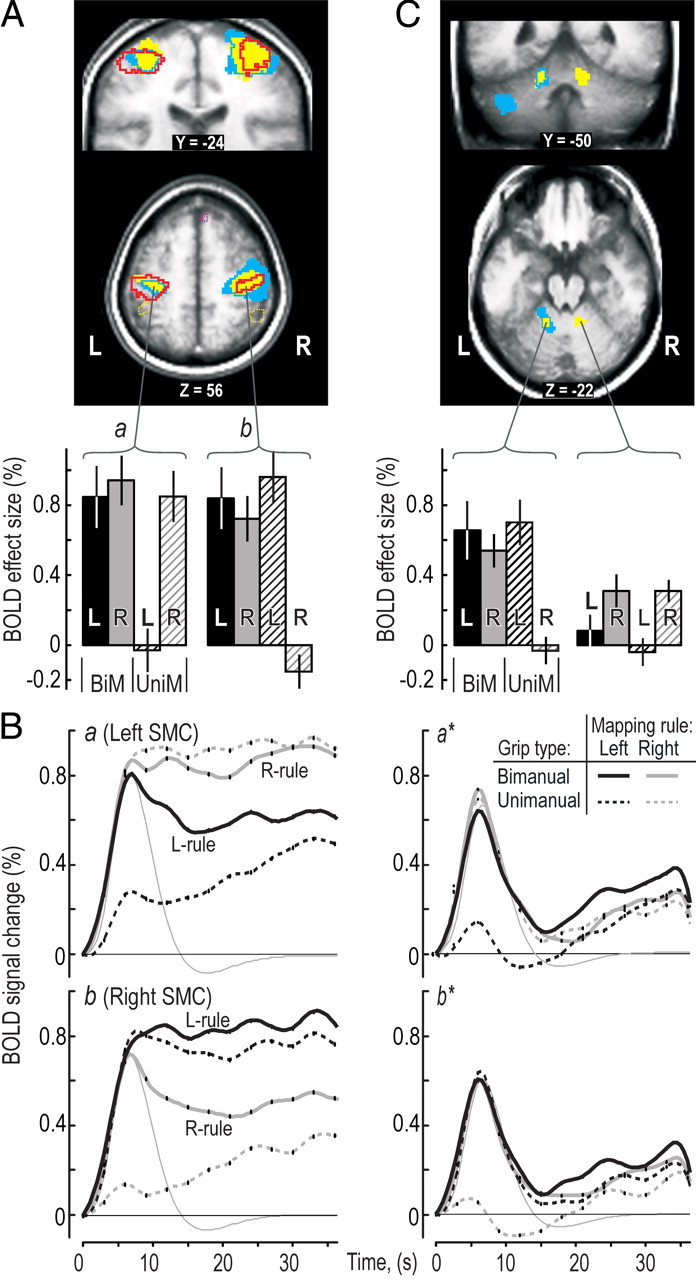
In bimanual object manipulation tasks, people flexibly assign one hand as a prime actor while the other assists. Little is known, however, about the neural mechanisms deciding the role assignment. We addressed this issue in a task in which participants moved a cursor to hit targets on a screen by applying precisely coupled symmetrical opposing linear and twist forces on a tool held freely between the hands. In trials presented in an unpredictable order, the action of either the left or the right hand was spatially congruent with the cursor movements, which automatically rendered the left or right hand the dominant actor, respectively. Functional magnetic resonance imaging indicated that the hand-selection process engaged prefrontal cortical areas belonging to an executive control network presumed critical for judgment and decision-making and to a salience network attributed to evaluation of utility of actions. Task initiation, which involved switching between task sets, had a superordinate role with reference to hand selection. Behavioral and brain imaging data indicated that participants initially expressed two competing action representations, matching either mapping rule, before selecting the appropriate one based on the consequences of the initial manual actions. We conclude that implicit processes engaging the prefrontal cortex reconcile selections among action representations that compete for the establishment of a dominant actor in bimanual object manipulation tasks. The representation selected is the one that optimizes performance by relying on the superior capacity of the brain to process spatial congruent, as opposed to noncongruent, mappings between manual actions and desired movement goals.


Figures

Figure 1.
Figure 1.
Apparatus, experimental design, and target distribution on screen. A, Each trial involved a hold task (18 s) during which a picture instructed the participant how to grasp the tool (see B), followed by the target-chasing task (36 s) and a rest period (18 s) in which the participant first released the tool and then rested while fixating a crosshair. The top graph shows the distribution of target positions (squares) with the cursor shown in the center of the screen (white dot). Straight lines connect consecutively appearing targets. The width of the vertical gray bar initially during the target-chasing task indicates the time of the hand-selection phase in bimanual trials (averaged across participants). The width of the vertical solid black line indicates the time between the appearance of the first target and the start of cursor movements (task initiation). B, Tool used by the participants to control the cursor by bimanually (a and b) or unimanually (c and d) applying linear forces and torques to the tool. The corresponding solid line arrows in top graph of A indicate the two different mapping rules relating forces and torques to cursor movements, i.e., the left-hand and the right-hand mapping rule. For the unimanual trials (c and d), the left-hand and the right-hand mapping rule was applied when the left and right hand acted, respectively. Note that selection of the prime actor occurred initially during the target-chasing task only in the bimanual trials (hand-selection phase), whereas a switching from the hold task to the target-chasing task occurred for all trial types.
Figure 2.
Figure 2.
Participants' performance in the scanner. A, Cursor trajectories exemplified for movements toward the first, second, and the third targets for a bimanual and a unimanual trial by a single participant. The thick segment of the movement trajectory represents the movement toward the first target (1). Arrowheads indicate the direction of cursor movement. B, Hit time and path index for the first, second, and third movements and for movements to targets during the steady-state performance (Ss) recorded in bimanual and unimanual trials. Heights of columns give mean values computed across participants for data pooled across the left- and the right-hand mapping rule, and error bars indicate 1 SD (n = 16); mapping rule influenced neither hit time nor path index (data not shown). C, Hand asymmetry index recorded during the bimanual trials. Positive and negative values indicate by which degree left and right hand served as prime actor, respectively. Data compiled across participants as in B. D, Distribution of hit time and path index for the first movement for bimanual and unimanual trials by all participants (n = 128). E, Assessment of the hand-selection phase during the bimanual trials exemplified by data from a single trial with each mapping rule by one participant. Dotted horizontal lines indicate the criterion value (3 SD above the mean during the steady-state period), and the dotted vertical line illustrates the time when the appropriate mapping rule was considered being implemented after the commencement of the target-chasing task (time 0). The numbers give the estimated duration of the hand-selection phase for each trial.
Figure 3.
Figure 3.
Prefrontal and posterior parietal areas engaged during the hand-selection phase in the bimanual trials. A, Clusters with a main effect of grip type (bimanual, unimanual) superimposed on the MNI “glass brain.” Purple and yellow areas indicate clusters located in prefrontal and posterior parietal cortical areas, respectively, and areas outlined in red depict mark cluster in the SMC regions. Histograms show, for each grip type (BiM, bimanual; UniM, unimanual) and mapping rule (L, left-hand; R, right-hand), the BOLD effect sizes (β values) in percentage relative to mean BOLD signal level during the session. Height of columns gives mean value across participants, and vertical lines represent 1 SE (n = 16). B, Left column shows the time course of the BOLD signal averaged across all voxels in the clusters labeled by a, b, and c in A for data obtained in the bimanual and unimanual trials, respectively. The signal change is given in percentage relative to mean of session, and the curves are aligned to zero at the onset of the target-chasing task. The thin gray curve shows the time course of the hemodynamic response function corresponding to the regressor representing the hand-selection phase averaged across participants and arbitrarily scaled. Right column shows the corresponding BOLD data after the variation in the BOLD signal explained by the other regressors in the model was factored out, thus providing a view of what the regressor representing the hand-selection phase can capture. The embossed segment of the abscissa indicates the period of the target-chasing task. Black dots indicate interscan intervals. C, D, Main effect of grip type within the prefrontal cortex (purple) and posterior parietal cortex (yellow) shown on coronal and transversal slices of the averaged brain calculated across the participant-specific T1-weighted images (n = 16) after being normalized to the MNI brain template. SPL, Superior parietal lobule; IPS, intraparietal sulcus; R, right; L, left; A, anterior; P, posterior.
Figure 4.
Figure 4.
BOLD signals in primary sensorimotor areas (SMC) during the hand-selection phase. A, Regions with a main effect of grip type (red outline), mapping rule (yellow), and interactions between these experimental factors (blue areas) shown on coronal and transversal slices through the SMC obtained as in Figure 3C. Purple and yellow dashed lines indicate clusters with a main effect of grip type in prefrontal and posterior parietal areas, respectively. Histograms below show, for each type of trial, BOLD effect sizes in the clusters with the main effect of grip type (BiM, bimanual; UniM, unimanual; L, left; R, right) obtained and presented as in Figure 3A. B, Time course of the BOLD signals during the performance of the target-chasing task averaged across all voxels in the clusters labeled by a and b in A for data obtained for each type of trial. Format and data processing as in Figure 3B. C, Effect of mapping rule (yellow areas) and significant interaction between grip type and mapping rule (blue areas and outlines) observed in cerebellum. Identified clusters shown on coronal and transversal slices. BOLD effect sizes as in the bottom of A.
Figure 5.
Figure 5.
Parietal–premotor cortical areas engaged during the hand-selection phase. A, Common activations in all trial types averaged across participants rendered on a single-subject standardized brain template in SPM2 viewed from a dorsal aspect (render depth, 20 mm; L, left; R, right; A, anterior; P, posterior). B, Common mesial frontal cortex activation shown on a sagittal slice of the brain obtained as described in the legend of Figure 3C. The vertical line indicates the position of the vertical plane passing through the anterior commissure. The depicted cluster involved both the superior frontal gyrus (BA 6; local maximum at −4, −4, 58) and the middle cingulate gyrus (BA 24; −4, 6, 36).
Figure 6.
Figure 6.
Brain regions involved in task switching. A, Time for initiating cursor movements to a target appearing at an unpredictable location on the screen during the target-chasing task. Columns refer to the first, second, and third movements and for movements to targets during the steady-state performance (Ss) recorded in bimanual and unimanual trials. Heights of columns give mean values computed across participants for data pooled across the left-hand and right-hand mapping rule, and error bars indicate 1 SD (n = 16); mapping rule influenced neither hit time nor path index (data not shown). B, The MNI glass brain shows brain areas activated during initiation of the target-chasing task (orange areas) and, for comparison, an outline of prefrontal areas activated during the hand-selection phase in the bimanual trials (purple contours). C, The same brain regions as in A shown on coronal, sagittal, and transversal slices of the brain obtained as described in the legend of Figure 3C. Vertical line on sagittal slices indicates the position of the vertical plane passing through the anterior commissure. Put., Putamen; POJ, parieto-occipital junction. D, Time course of the BOLD signals during performance of the target-chasing task averaged across all voxels in the clusters labeled by a, b, and c in B for data obtained during each type of trial. Format and data processing as in Figure 3B.

Similar articles

Cited by

References

    1. Bunge SA. How we use rules to select actions: a review of evidence from cognitive neuroscience. Cogn Affect Behav Neurosci. 2004;4:564–579. - PubMed
    1. Burnod Y, Baraduc P, Battaglia-Mayer A, Guigon E, Koechlin E, Ferraina S, Lacquaniti F, Caminiti R. Parieto-frontal coding of reaching: an integrated framework. Exp Brain Res. 1999;129:325–346. - PubMed
    1. Cao J. The size of the connected components of excursion sets of χ2, t and F fields. Adv Appl Probab. 1999;31:579–595.
    1. Cisek P. Cortical mechanisms of action selection: the affordance competition hypothesis. Philos Trans R Soc Lond B Biol Sci. 2007;362:1585–1599. - PMC - PubMed
    1. Cisek P, Kalaska JF. Neural correlates of reaching decisions in dorsal premotor cortex: specification of multiple direction choices and final selection of action. Neuron. 2005;45:801–814. - PubMed

Publication types

LinkOut - more resources