. 2010 Aug 4;30(31):10493-506.
doi: 10.1523/JNEUROSCI.1546-10.2010.

Attentional facilitation throughout human visual cortex lingers in retinotopic coordinates after eye movements

Affiliations

Attentional facilitation throughout human visual cortex lingers in retinotopic coordinates after eye movements

Julie D Golomb et al. J Neurosci. .

Abstract

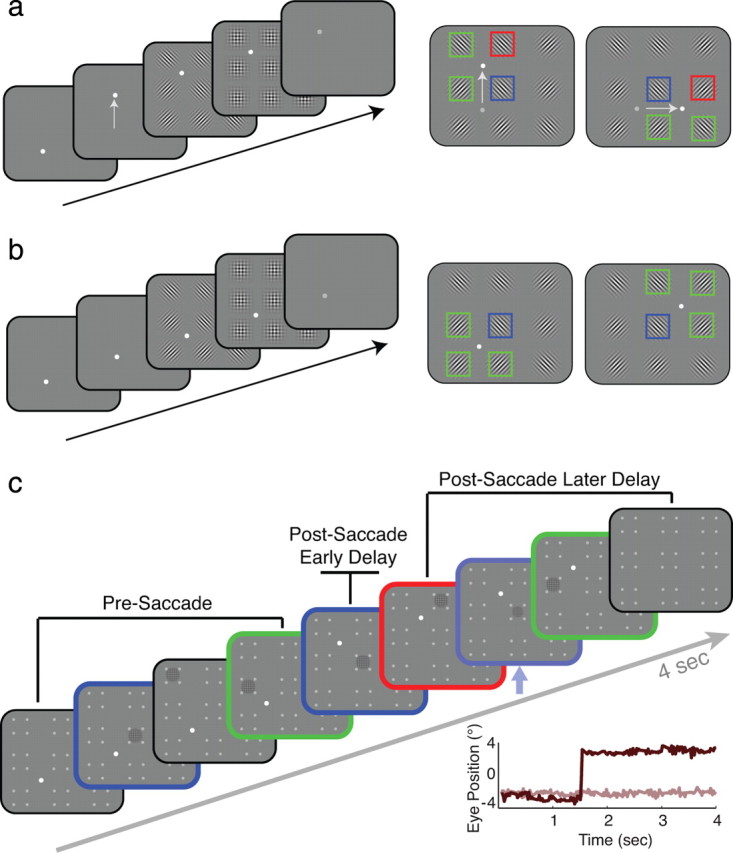
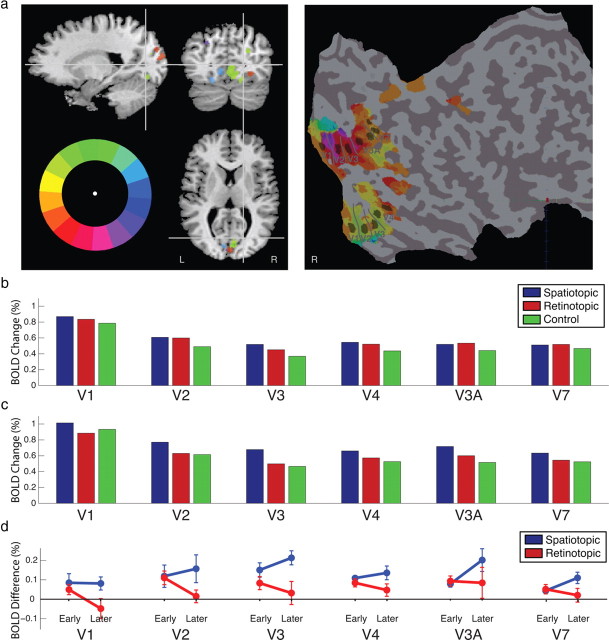
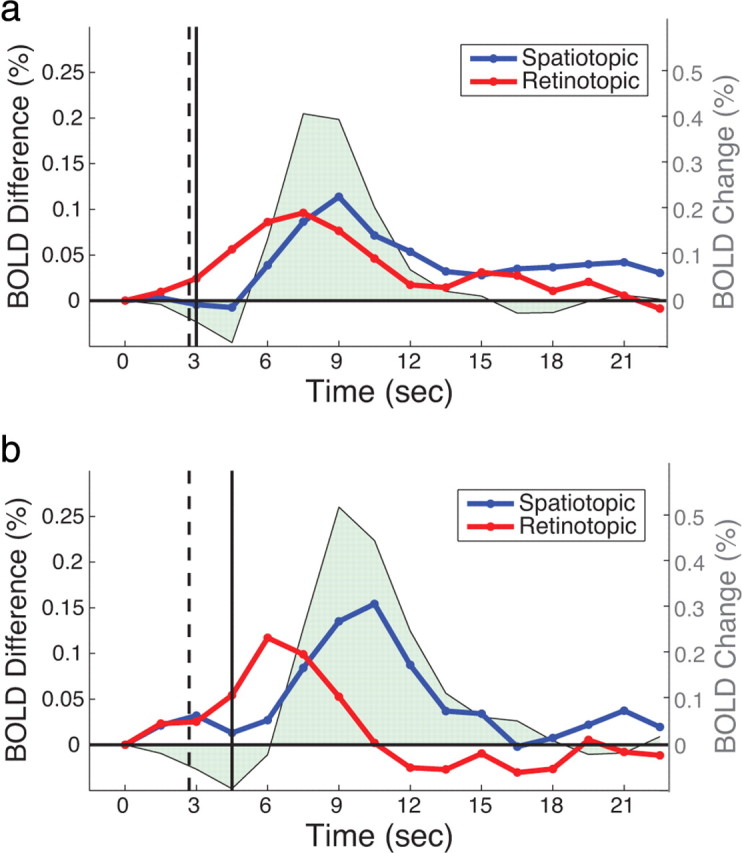
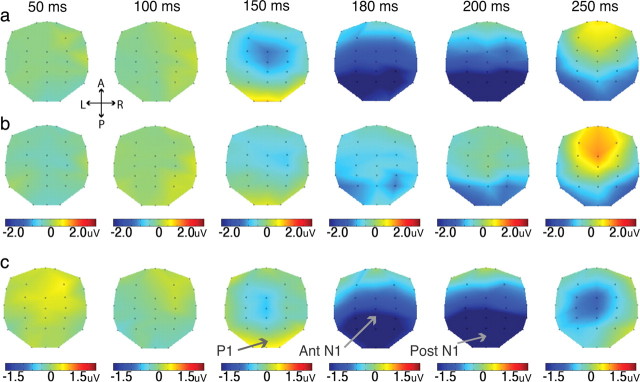
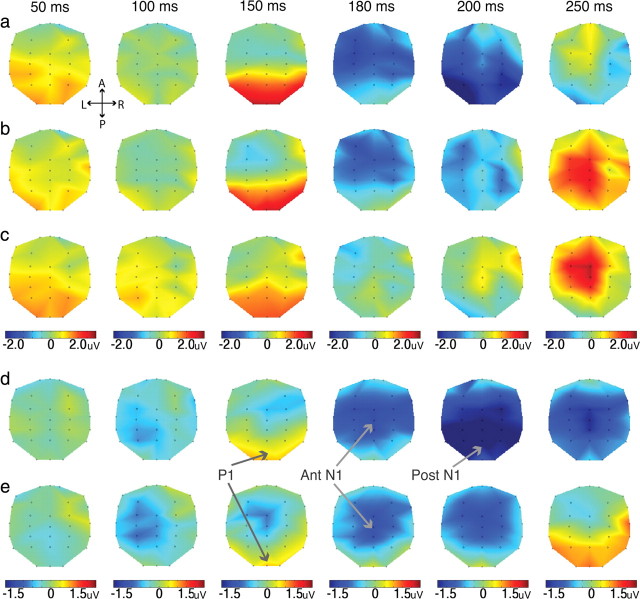
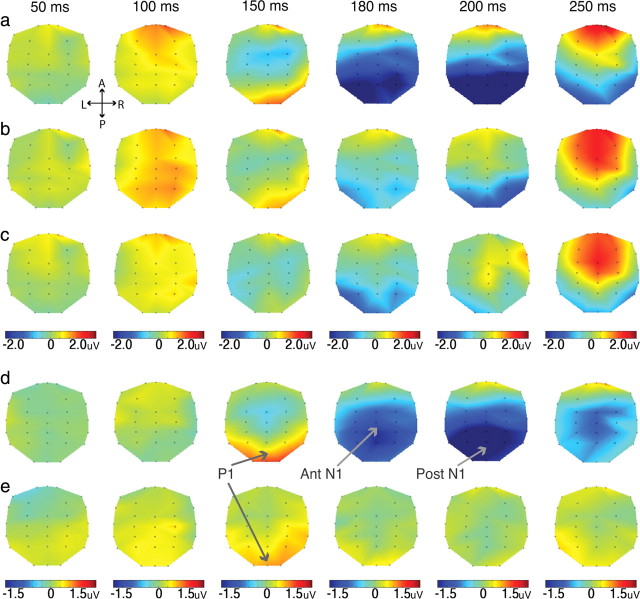
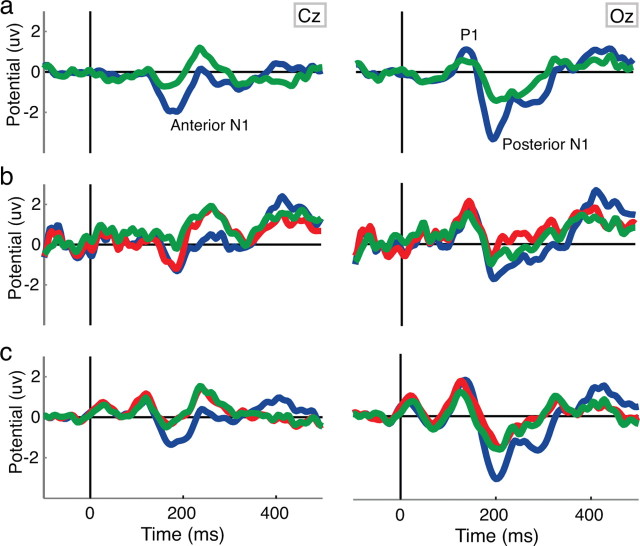
With each eye movement, the image of the world received by the visual system changes dramatically. To maintain stable spatiotopic (world-centered) visual representations, the retinotopic (eye-centered) coordinates of visual stimuli are continually remapped, even before the eye movement is completed. Recent psychophysical work has suggested that updating of attended locations occurs as well, although on a slower timescale, such that sustained attention lingers in retinotopic coordinates for several hundred milliseconds after each saccade. To explore where and when this "retinotopic attentional trace" resides in the cortical visual processing hierarchy, we conducted complementary functional magnetic resonance imaging and event-related potential (ERP) experiments using a novel gaze-contingent task. Human subjects executed visually guided saccades while covertly monitoring a fixed spatiotopic target location. Although subjects responded only to stimuli appearing at the attended spatiotopic location, blood oxygen level-dependent responses to stimuli appearing after the eye movement at the previously, but no longer, attended retinotopic location were enhanced in visual cortical area V4 and throughout visual cortex. This retinotopic attentional trace was also detectable with higher temporal resolution in the anterior N1 component of the ERP data, a well established signature of attentional modulation. Together, these results demonstrate that, when top-down spatiotopic signals act to redirect visuospatial attention to new retinotopic locations after eye movements, facilitation transiently persists in the cortical regions representing the previously relevant retinotopic location.


Figures

Figure 1.
Figure 1.
Task design. a, b, fMRI task. Subjects fixated and saccaded between four locations (white dots), while continuously attending to the central target location. a, Saccade trials. After ∼3 s of stable fixation, the fixation dot moved to a new location, and subjects executed a single accurate saccade (gray arrow not actually present on screen). After 50 or 1550 ms, an array of Gabor patches appeared simultaneously in the nine locations shown for 250 ms, followed by a 250 ms mask array. Subjects always reported the orientation of the stimulus in the central target location regardless of current fixation position. The four stimuli immediately surrounding the final fixation, corresponding to the four visual field quadrants, were coded according to whether they occupied the spatiotopic (blue), retinotopic (red), or control (green) positions. Different saccade patterns placed these locations in different quadrants for each trial. b, For no-saccade trials, the fixation dot never moved, and subjects remained fixated for either 1.5 or 3 s before the stimuli appeared. The four stimulus quadrants were coded as spatiotopic/retinotopic (blue) or control (green). The fixation dot dimmed for 18 s between trials. c, ERP task. An example 4 s trial is illustrated, with corresponding eye trace below (dark brown is vertical eye position, light brown is horizontal). Subjects fixated the white dot and attended to the central target location. Placeholders demarcating the nine possible stimulus locations were present on the screen at all times (dim gray spots). Stimuli appeared one at a time every 250–550 ms. Subjects pressed a button any time a smaller target stimulus appeared in the target location (light blue arrow). At an unpredictable delay (here ∼1.5 s into the trial), the fixation dot jumped to a new location and subjects executed a saccade while continuing to monitor the spatiotopic target location. Stimuli were classified according to delay condition (presaccade, postsaccade early, postsaccade later), and position (spatiotopic, blue; retinotopic, red; control, green). Responses to target stimuli or stimuli appearing at other positions were not analyzed.
Figure 2.
Figure 2.
V4 time courses and peak activation. Solid black line indicates stimulus presentation, and dotted black line is saccade time. a, b, No-saccade trials. Blue is the response to the spatiotopic/retinotopic target stimulus, and green is the response to control nontarget. a, No-saccade early. b, No-saccade later. c, d, Saccade trials. Blue is response to spatiotopic target, red to retinotopic nontarget, and green to control nontarget. c, Saccade early (stimulus 50 ms after saccade completion). d, Saccade later (stimulus 1550 ms after saccade completion). e, Peak facilitation for retinotopic and spatiotopic positions compared with control; error bars are SEM (n = 6).
Figure 3.
Figure 3.
Occipital ROIs and activation. a, ROIs for a representative subject. Left, Areas V1–V7 color coded according to quadrant, based on the visual field legend at the bottom left. ROIs were restricted to the target eccentricity used in the main task. Right, Sample flat map for the right hemisphere. Combined activation map from all retinotopic mapping runs is displayed colored according to the same legend. ROIs are drawn on top of the activation map. b, c, Peak activation for spatiotopic, retinotopic, and control stimuli for areas V1–V7. b, Saccade early delay. c, Saccade later delay. d, Peak facilitation for retinotopic and spatiotopic positions (compared with control) for early and late delays; error bars are SEM (n = 6).
Figure 4.
Figure 4.
Time course of facilitation, V4. Spatiotopic and retinotopic facilitation (difference from control) at each time point. A magnitude of zero means no difference from control, and positive values reflect attentional facilitation. BOLD time course for control stimulation superimposed in background (right axis). Solid black line indicates stimulus onset, and dotted line indicates saccade time. a, Saccade early delay. b, Saccade later delay. n = 6.
Figure 5.
Figure 5.
ERP voltage maps over time for presaccade stimuli. a, b, Grand-averaged ERP voltage maps at specified time points after presentation of a stimulus in the attended spatiotopic/retinotopic location (a) and unattended control location (b). c, Difference activity (spatiotopic/retinotopic − control) over the same time period. Electrode locations are depicted on a top-down view of the skull, oriented according to the anterior/posterior (A/P) and left/right (L/R) axes pictured. Attentionally modulated P1, anterior N1, and posterior N1 components are labeled with arrows. n = 14.
Figure 6.
Figure 6.
ERP voltage maps over time for postsaccade early-delay stimuli. a–c, Grand-averaged ERP voltage maps at specified time points after presentation of a stimulus in the spatiotopic (a), retinotopic (b), and control (c) locations. d, e, Difference activity relative to control over the same time period. d, Spatiotopic–control. e, Retinotopic– control. Electrode locations are depicted on a top-down view of the skull, oriented according to the anterior/posterior (A/P) and left/right (L/R) axes pictured. Attentionally modulated P1, anterior N1, and posterior N1 components are labeled with arrows. n = 14.
Figure 7.
Figure 7.
ERP voltage maps over time for postsaccade later-delay stimuli. a–c, Grand-averaged ERP voltage maps at specified time points after presentation of a stimulus in the spatiotopic (a), retinotopic (b), and control (c) locations. d, e, Difference activity relative to control over the same time period. d, Spatiotopic–control. e, Retinotopic–control. Electrode locations are depicted on a top-down view of the skull, oriented according to the anterior/posterior (A/P) and left/right (L/R) axes pictured. Attentionally modulated P1, anterior N1, and posterior N1 components are labeled with arrows. n = 14.
Figure 8.
Figure 8.
ERPs at characteristic electrodes reflecting P1, anterior N1, and posterior N1 components. Components labeled near peak latency. a, Attentional modulation for presaccade stimuli (blue, spatiotopic/retinotopic; green, control). b, Attentional modulation for postsaccade early-delay stimuli (blue, spatiotopic; red, retinotopic; green, control). c, Attentional modulation for postsaccade later stimuli (blue, spatiotopic; red, retinotopic; green, control). n = 14.

Similar articles

Cited by

References

    1. Andersen RA, Snyder LH, Bradley DC, Xing J. Multimodal representation of space in the posterior parietal cortex and its use in planning movements. Annu Rev Neurosci. 1997;20:303–330. - PubMed
    1. Awh E, Anllo-Vento L, Hillyard SA. The role of spatial selective attention in working memory for locations: evidence from event-related potentials. J Cogn Neurosci. 2000;12:840–847. - PubMed
    1. Bisley JW, Goldberg ME. Neural correlates of attention and distractibility in the lateral intraparietal area. J Neurophysiol. 2006;95:1696–1717. - PMC - PubMed
    1. Brainard DH. The psychophysics toolbox. Spat Vis. 1997;10:433–436. - PubMed
    1. Bridgeman B, Van der Heijden AHC, Velichkovsky BM. A theory of visual stability across saccadic eye movements. Behav Brain Sci. 1994;17:247–257.

Publication types

LinkOut - more resources