. 2010 Aug 4;30(31):10541-50.
doi: 10.1523/JNEUROSCI.0146-10.2010.

Quantitative relationships between huntingtin levels, polyglutamine length, inclusion body formation, and neuronal death provide novel insight into huntington's disease molecular pathogenesis

Affiliations

Quantitative relationships between huntingtin levels, polyglutamine length, inclusion body formation, and neuronal death provide novel insight into huntington's disease molecular pathogenesis

Jason Miller et al. J Neurosci. .

Abstract

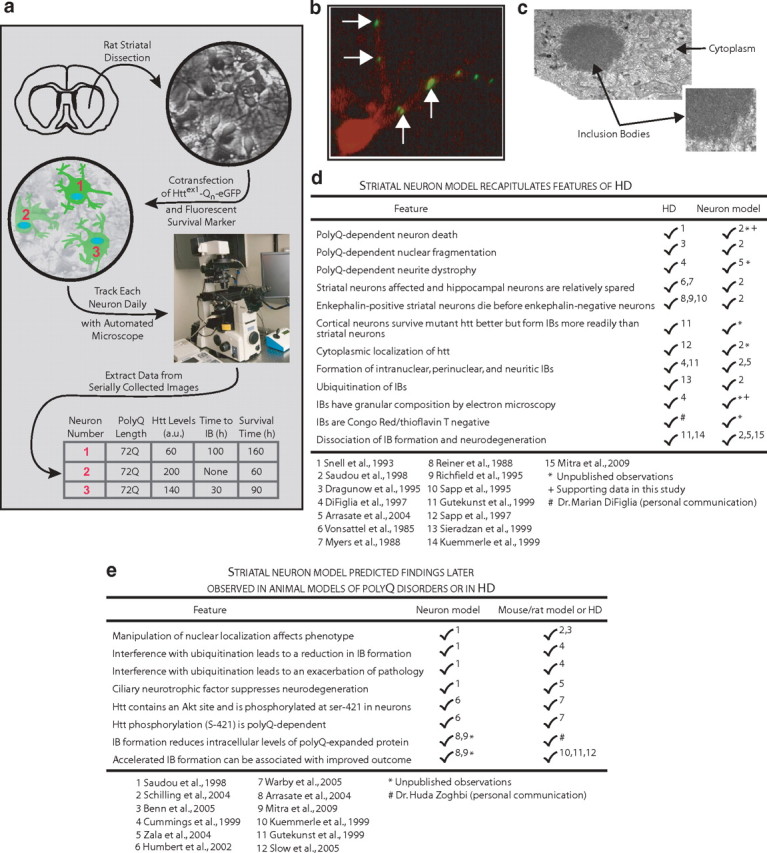
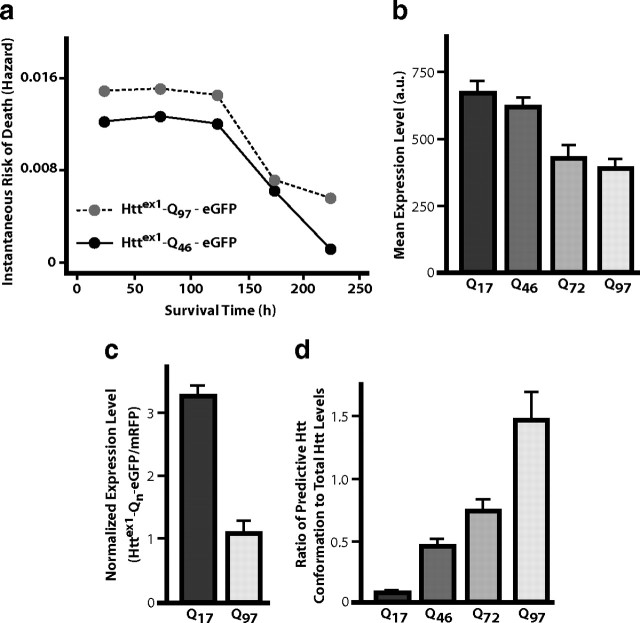
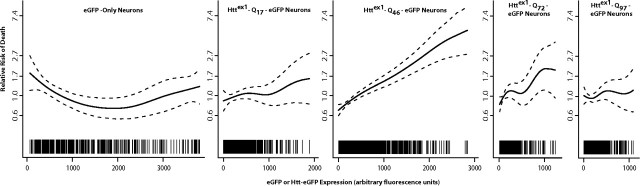
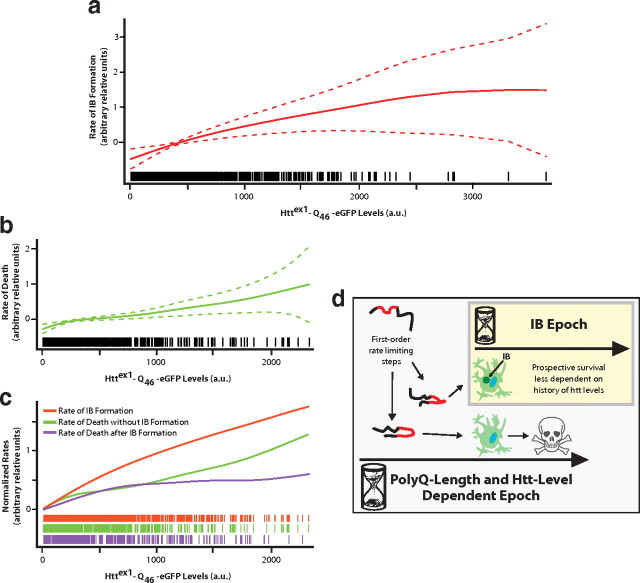
An expanded polyglutamine (polyQ) stretch in the protein huntingtin (htt) induces self-aggregation into inclusion bodies (IBs) and causes Huntington's disease (HD). Defining precise relationships between early observable variables and neuronal death at the molecular and cellular levels should improve our understanding of HD pathogenesis. Here, we used an automated microscope that tracks thousands of neurons individually over their entire lifetime to quantify interconnected relationships between early variables, such as htt levels, polyQ length, and IB formation, and neuronal death in a primary striatal model of HD. The resulting model revealed that mutant htt increases the risk of death by tonically interfering with homeostatic coping mechanisms rather than producing accumulated damage to the neuron, htt toxicity is saturable, the rate-limiting steps for inclusion body formation and death can be traced to different conformational changes in monomeric htt, and IB formation reduces the impact of the starting levels of htt of a neuron on its risk of death. Finally, the model that emerges from our quantitative measurements places critical limits on the potential mechanisms by which mutant htt might induce neurodegeneration, which should help direct future research.


Figures

Figure 1.
Figure 1.
Primary striatal neuron model of HD. a, Schematic of automated microscopy applied to a primary striatal neuron model of HD. Striata from E18–E20 rat brains were dissected, dissociated, and cultured for 4–6 d. Low efficiency (1–5%) calcium phosphate cotransfection of httex1-Qn-eGFP constructs and a fluorescent protein survival marker (e.g., mRFP) facilitated tracking of individual transfected neurons. Thousands of individual neurons were then tracked daily via an automated microscope for 1–2 weeks, with plates returned to the incubator between imaging runs. From the series of images, the htt levels, time to IB formation, and survival time of each neuron were measured. These data, along with the polyQ length of the transfected httex1 construct, were then recorded for each neuron in a spreadsheet. b, A typical rat striatal neuron transfected with eGFP-tagged mutant htt (green) and the morphology marker mRFP (red) exhibiting neuritic IBs (arrows), which are found in HD. c, IBs in this model system have a granular composition by electron microscopy, as seen in human HD patients. Electron microscopy was performed on rat striatal neurons transfected with mutant htt. The inset is an enlarged view of the IB. d, This striatal neuron model of HD recapitulates numerous features of the human disease. e, The model has also predicted several findings later observed in animal models of polyQ disorders or in human HD patients.
Figure 2.
Figure 2.
Expanded polyQ results in an initially constant, then decreasing, rate of death, decreased htt expression, and increases in a specific htt conformation. a, Risk of death (graphed as instantaneous hazard in actuarial survival analysis) was plotted against survival time for a cohort of striatal neurons transfected with httex1-Q46-eGFP and another cohort transfected with httex1-Q97-eGFP. b, Increasing polyQ length results in lower htt expression levels. Mean diffuse htt expression level (in arbitrary units of fluorescence) for httex1-Q17, 46, 72, or 97-eGFP-transfected neurons, measured with automated microscopy at 24 h after transfection. Neurons that form IBs by 24 h are excluded from the analysis. c, Normalized diffuse htt expression levels for neurons fixed 24 h after transfection. For each neuron, levels of diffuse htt, estimated from htt-eGFP fluorescence, were normalized to the fluorescence of the transfection marker mRFP to control for differences in transfection and transcriptional activation. d, Increasing polyQ length preferentially leads to an increase in the abundance of a htt conformer that strongly predicts neuronal death. Neurons transfected with httex1-Q17, 46, 72, or 97-eGFP were fixed at 24 h and immunostained with a monoclonal antibody, 3B5H10, which recognizes a conformation of htt that predicts neuronal death. Levels of antibody staining in each neuron were quantified via immunofluorescence and normalized to the htt levels of that neuron, as measured by eGFP fluorescence. An analysis of absolute levels of 3B5H10 conformer (not normalized to htt levels) confirmed the trends in d (data not shown). All error bars are 95% confidence intervals.
Figure 3.
Figure 3.
Saturable relationship between htt levels and neuronal death. Relative risk of death versus expression levels for eGFP or httex1-Q17,46,72, or 97-eGFP-transfected striatal neurons. The dotted lines represent SE bands. The vertical hash marks represent the htt levels for individual neurons in each dataset. Because the Cox analysis for each graph was performed separately, comparisons of absolute risk between graphs is not possible. The x-axes were slightly truncated for the httex1-Q17,46,72, or 97-eGFP graphs because error bands became very large (>1 log unit of relative risk). Cox relative risk estimators for each dataset are shown in Table 1.
Figure 4.
Figure 4.
Different conformational changes in monomeric htt may be the rate-limiting steps for neuronal death and a protective response marked by IB formation. a, Rate of IB formation has a primarily first-order dependence on httex1-Q46-eGFP concentration. Linear component of the fitted regression, p < 10−99; nonlinear component to fitted regression, p = 0.005. The nonlinear component to the regression is clearly below first-order, as demonstrated by the decelerating slope of the regression line. The dotted lines represent SE bands. The vertical hash marks represent the htt levels for individual neurons in the dataset. b, Rate of death has a first-order dependence on httex1-Q46-eGFP concentration. Linear component of the fitted regression, p = 2.9 × 10⁻¹²; nonlinear component to fitted regression, p = 0.22. SE bands and vertical hash marks are as in a. c, Comparison of htt concentration dependence for the rates of IB formation (red), death without IB formation (green), and death after IB formation (purple). To facilitate comparison, x-intercepts for each curve have been normalized to 0. The rate of IB formation has the strongest concentration dependence, followed by the rate of death without IB formation. In contrast, death rates after IB formation have a diminished dependence on pre-IB htt levels, suggesting the neuron has entered an adapted epoch. The colored vertical hashes represent the htt levels for individual neurons in each respective dataset. d, Model of htt molecular pathogenesis consistent with data from Figure 4. Different first-order rate-limiting changes in monomeric htt conformation (polyQ stretch in red) lead to divergent fates for the neuron. One fate involves accelerated neuronal death, in which time to death can be reliably predicted by the combination of the htt levels of the neuron and polyQ length. The other fate involves an adapted epoch, marked by IB formation. Survival time in this epoch has a diminished dependence on the pre-IB htt levels of the neuron.

Similar articles

Cited by

References

    1. Arrasate M, Finkbeiner S. Automated microscope system for determining factors that predict neuronal fate. Proc Natl Acad Sci U S A. 2005;102:3840–3845. - PMC - PubMed
    1. Arrasate M, Mitra S, Schweitzer ES, Segal MR, Finkbeiner S. Inclusion body formation reduces levels of mutant huntingtin and the risk of neuronal death. Nature. 2004;431:805–810. - PubMed
    1. Benn CL, Landles C, Li H, Strand AD, Woodman B, Sathasivam K, Li SH, Ghazi-Noori S, Hockly E, Faruque SM, Cha JH, Sharpe PT, Olson JM, Li XJ, Bates GP. Contribution of nuclear and extranuclear polyQ to neurological phenotypes in mouse models of Huntington's disease. Hum Mol Genet. 2005;14:3065–3078. - PubMed
    1. Bennett EJ, Bence NF, Jayakumar R, Kopito RR. Global impairment of the ubiquitin-proteasome system by nuclear or cytoplasmic protein aggregates precedes inclusion body formation. Mol Cell. 2005;17:351–365. - PubMed
    1. Brooks E, Arrasate M, Cheung K, Finkbeiner SM. Using antibodies to analyze polyglutamine stretches. Methods Mol Biol. 2004;277:103–128. - PubMed

Publication types

MeSH terms