. 2010 Nov;299(5):C994-C1006.
doi: 10.1152/ajpcell.00544.2009. Epub 2010 Aug 4.

Characterization of hTERT-immortalized osteoblast cell lines generated from wild-type and connexin43-null mouse calvaria

Affiliations

Characterization of hTERT-immortalized osteoblast cell lines generated from wild-type and connexin43-null mouse calvaria

Mia M Thi et al. Am J Physiol Cell Physiol. 2010 Nov.

Abstract

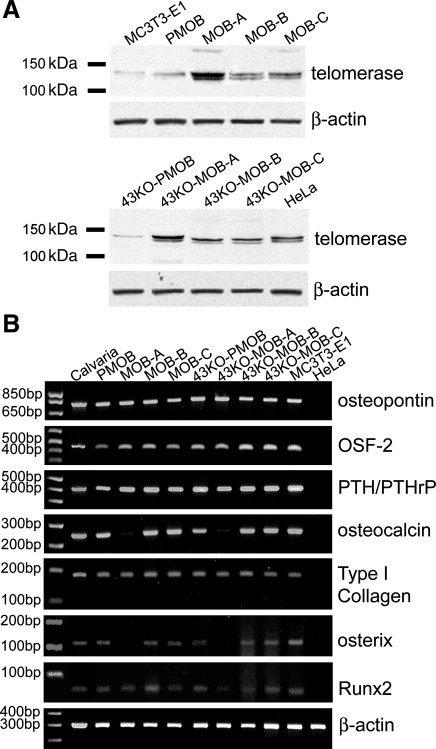
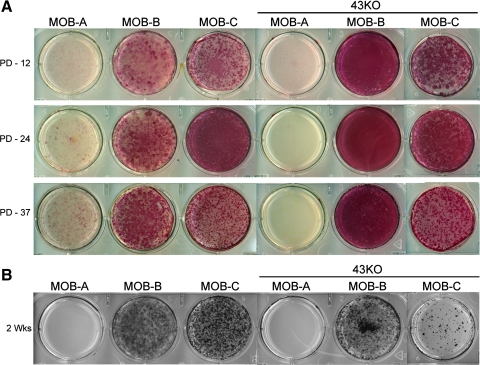
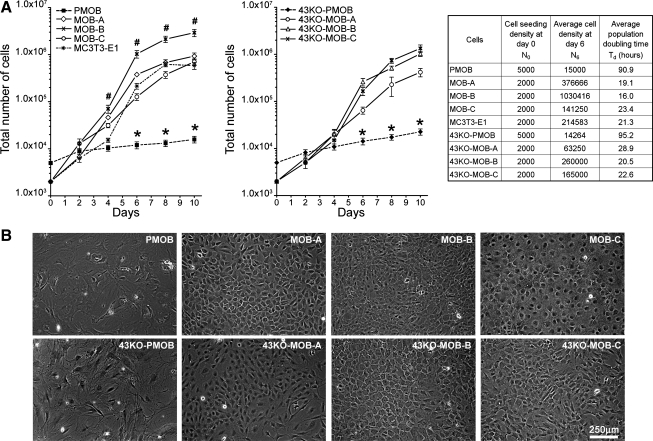
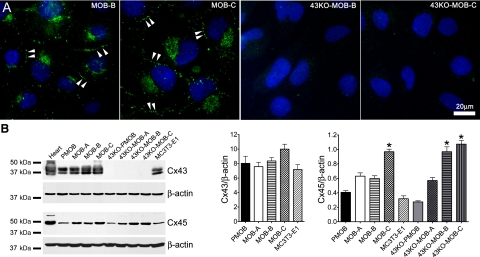
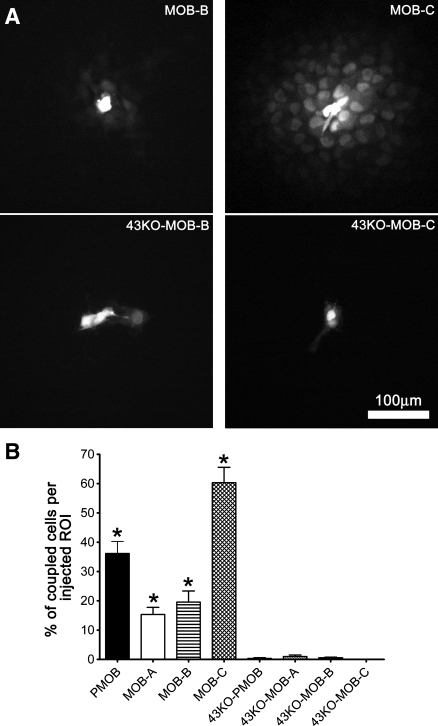
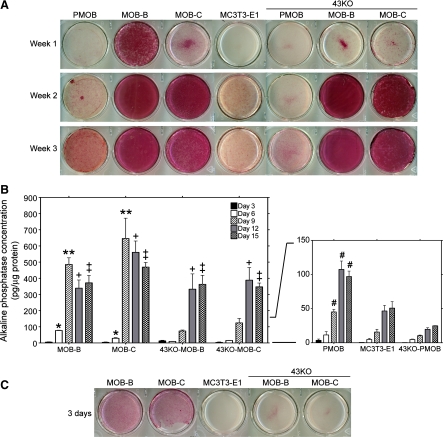
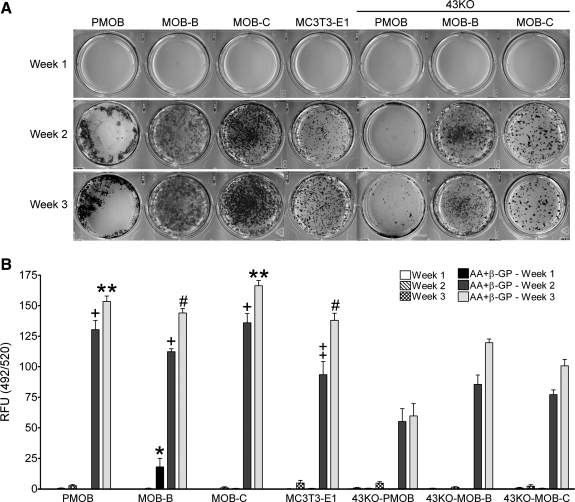
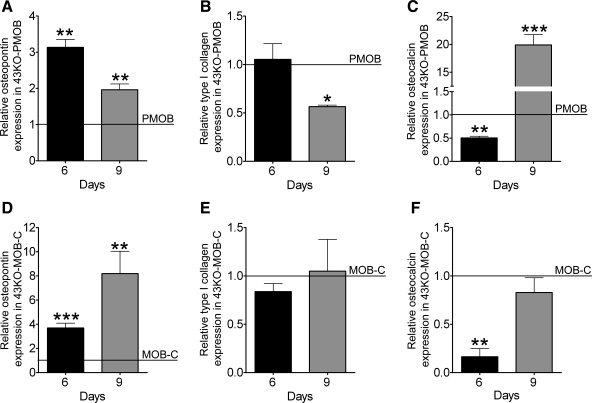
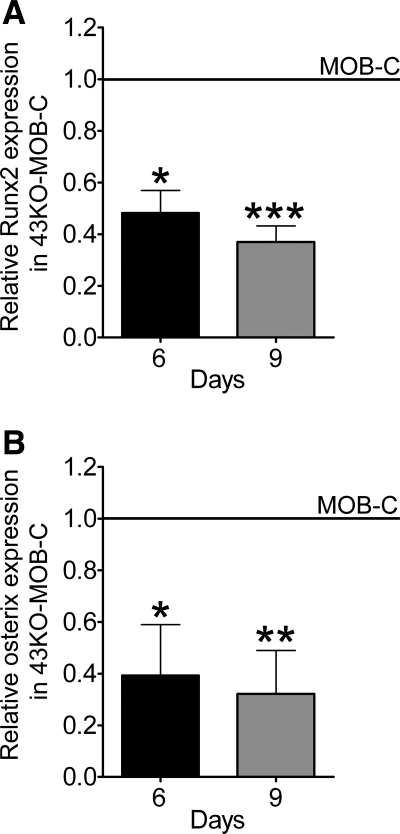
The gap junction protein connexin43 (Cx43) has been proposed to play key roles in bone differentiation and mineralization, but underlying cellular mechanisms are not totally understood. To further explore roles of Cx43 in these processes, we immortalized calvarial osteoblasts from wild-type and Cx43-null mice using human telomerase reverse transcriptase (hTERT). Osteoblastic (MOB) cell lines were generated from three individual wild-type and three individual Cx43-null mouse calvaria. Average population doubling times of the cell lines were higher than of the primary osteoblasts but did not greatly differ with regard to genotype. Modest to high level of Cx45 expression was detected in MOBs of both genotypes. Most of the cell lines expressed osteoblastic markers [Type I collagen, osteopontin, osteocalcin, parathyroid hormone/parathyroid hormone-related peptide receptor (PTH/PTHrP), periostin (OSF-2), osterix (Osx), runt-related transcription factor 2 (Runx2), alkaline phosphatase (ALP)], and mineralization was comparable to that of primary osteoblasts. Two MOB cell lines from each genotype with most robust maintenance of osteoblast lineage markers were analyzed in greater detail, revealing that the Cx43-null cell lines showed a significant delay in early differentiation (up to 9 days in culture). Matrix mineralization was markedly delayed in one of the Cx43-null lines and slightly delayed in the other. These findings comparing new and very stable wild-type and Cx43-null osteoblastic cell lines define a role for Cx43 in early differentiation and mineralization stages of osteoblasts and further support the concept that Cx43 plays important role in the cellular processes associated with skeleton function.


Figures

Fig. 1.
Fig. 1.
Expression of telomerase and osteoblastic markers in primary calvarial osteoblasts and human telomerase reverse transcriptase (hTERT)-immortalized cell lines. A: telomerase expression in hTERT-immortalized mouse wild-type (MOB) and connexin43 (Cx43)-null (43KO-MOB) osteoblastic cell lines detected by Western blotting. Equal amounts of protein from HeLa, MOBs, 43KO-MOBs, MC3T3-E1, primary mouse wild-type osteoblasts (PMOB), and Cx43-null osteoblasts (43KO-PMOB) were used. HeLa cells were used as positive control. B: RT-PCR analysis of osteoblastic markers (osteopontin, OSF-2, PTH/PTHrP-R, osteocalcin, and type I collagen), two transcription factors associated with bone formation and mineralization [runt-related transcription factor 2 (Runx2) and osterix (Osx)] and β-actin (loading control) in MOBs and 43KO-MOBs. The expression of the osteoblastic markers and bone formation and mineralization associated transcription factors from 10-day culture of the hTERT-immortalized cells were compared with those of wild-type calvarial tissue, primary wild-type and Cx43-null osteoblasts, MC3T3E-1, and HeLa (negative control).
Fig. 2.
Fig. 2.
Assessment of osteoblast phenotypic characteristics in hTERT-immortalized MOB and 43KO-MOB mouse cell lines using the key osteogenic marker alkaline phosphatase (ALP) after 12, 24, and 37 population doubling (PD-12, PD-24, PD-37) (A), and the capability to form mineralized extracellular matrix, as determined by von Kossa staining (B). MOBs, 43KO-MOBs, MC3T3-E1 (seeded at 1.5 × 10³ cells/cm2), PMOB, and 43KO-PMOB (seeded at 2.0 × 10⁴ cells/cm2) were seeded in six-well plates and stained 2 wk after being plated.
Fig. 3.
Fig. 3.
A: growth kinetics for hTERT-immortalized MOB and 43KO-MOB mouse osteoblastic cell lines. MOBs, 43KO-MOBs, and MC3T3-E1 cells were seeded at 2 × 10³ cells/dish and PMOB and 43KO-PMOB mouse osteoblasts were seeded at 5 × 10³ cells/well in six-well plates and grown in α-MEM supplemented with 10% FBS for 2, 4, 6, 8, and 10 days. All data are presented as means ± SE, n = 5; *P < 0.01, #P < 0.05. P values were obtained using one-way ANOVA followed by Tukey's multiple comparison test. Population doubling times were calculated at the 90% cell confluency time point (day 6). B: morphological appearance of hTERT-immortalized cell lines observed by phase contrast microscopy. MOBs, 43KO-MOBs, and MC3T3-E1 were seeded at 2 × 10³ cells/well, and PMOB and 43KO-PMOB were seeded at 5 × 10³ cells/well in six-well plates and cultured for 8 days in α-MEM supplemented with 10% FBS.
Fig. 4.
Fig. 4.
A: assessment of Cx43 distribution in some of the hTERT-immortalized MOB and 43KO-MOB mouse osteoblastic cell lines. MOB-B, MOB-C, 43KO-MOB-B, and 43KO-MOB-C were seeded at 1.5 × 10³ cells/cm2 for 6 days and immunostained for Cx43, and cellular distribution of Cx43 was analyzed by epifluorescence microscopy. Double arrowheads, punctate Cx43 distribution at cell-cell appositional membrane. B: Western blot quantification of Cx43 and Cx45 expression levels in MOBs and 43KO-MOBs. Equal amounts of protein from mouse heart (positive control), MOBs, 43KO-MOBs, primary mouse wild-type (PMOB), Cx43-null (43KO-PMOB) osteoblasts, and MC3T3-E1 were used. Western blot analysis was performed using antibodies against Cx43, Cx45, and β-actin. Bar graphs correspond to average Cx43 and Cx45 expression levels determined by densitometric analysis of the Cx43 and Cx45 bands from three independent experiments, using the Scion NIH Image software. All acquired data were normalized with respect to β-actin (internal controls) and expressed as means ± SE, N = 3; *P < 0.05. P values were obtained using one-way ANOVA followed by Tukey's multiple comparison test.
Fig. 5.
Fig. 5.
Degree of gap junction coupling in the hTERT-immortalized osteoblastic cell lines. A: Lucifer yellow (LY) spread in MOB and 43KO-MOB cell lines. For the fields illustrated, LY spread to 19, 60, 0.5, and 0% of cells in the regions of interest in MOB-B, MOB-C, 43KO-MOB-B, and 43KO-MOB-C, respectively. B: overall quantification of the degree of dye coupling in the hTERT-immortalized osteoblasts, primary wild-type, and Cx43-null osteoblasts cultures. Values correspond to means ± SE, N = 5; *P < 0.0001. P values were obtained using one-way ANOVA followed by Tukey's multiple comparison test.
Fig. 6.
Fig. 6.
Differentiation of the hTERT-immortalized MOB and 43KO-MOB mouse osteoblastic cell lines. The hTERT-immortalized cells and MC3T3-E1 cells (seeded at 1.5 × 10³ cells/cm2) and PMOB and 43KO-PMOB mouse osteoblasts (seeded at 2.0 × 10⁴ cells/cm2) were seeded in six-well plates and cultured in α-MEM + 10% FBS for 1, 2, and 3 wk. Note, PMOB and 43KO-PMOB were seeded 10-fold more densely than MOBs, 43KO-MOBs, and MC3T3-E1 to attain a comparable cell density at the time of alkaline phosphatase (ALP) expression analysis. A: ALP expression in selected MOBs and 43KO-MOBs was compared with those of MC3T3-E1, PMOB, and 43KO-PMOB. B: quantification of ALP concentration in selected MOBs and 43KO-MOBs using pNPP ALP Assay Kit. ALP concentration and protein content were measured at day 3, 6, 9, 12, and 15. ALP concentration was calculated from standard curves generated for each set of experiments. Values of ALP concentration were then normalized to respective cellular protein content. Data are expressed as means ± SE, N = 3; *P < 0.01 (MOB-B and MOB-C vs. all other cells at day 6), **P < 0.001 (MOB-B and -C vs. all other cells at day 9), +P < 0.05 (MOB-B and -C, 43KO-MOB-B and -C vs. PMOB, MC3T3-E1, 43KO-PMOB at day 12), ‡P < 0.05 (MOB-B and -C, 43KO-MOB-B and -C vs. PMOB, MC3T3-E1, 43KO-PMOB at day 15), #P < 0.001 (PMOB vs. 43KO-PMOB from day 9 to day 15). P values were obtained using one-way ANOVA followed by Tukey's multiple comparison test. C: ALP expression in hTERT-immortalized cells under short-term cell culture condition. MOBs, 43KO-MOBs, and MC3T3-E1 were seeded at 104 cells/cm2 and cultured for 3 days in α-MEM + 10% FBS.
Fig. 7.
Fig. 7.
Assessment of matrix mineralization in the hTERT-immortalized MOB and 43KO-MOB mouse osteoblastic cell lines. The hTERT-immortalized cells and MC3T3-E1 cells (seeded at 1.5 × 10³ cells/cm2), and PMOB and 43KO-PMOB mouse osteoblasts (seeded 2.0 × 10⁴ cells/cm2) were seeded in six-well plates and cultured in α-MEM + 10% FBS supplemented with or without 25 μg/ml AA and 2 mM β-GP for 1, 2, and 3 wk. A: von Kossa staining in MOBs and 43KO-MOBs treated with AA + β-GP was compared with those of MC3T3-E1, PMOB, and 43KO-PMOB at 1, 2 and 3 wk in culture. B: quantification of in vitro osteoblast mineralization in the hTERT-immortalized cells, MC3T3-E1, PMOB, and 43KO-PMOB cells at 1, 2, and 3 wk in culture using OsteoImage Mineralization Assay Kit. The degree of HA nodule formation was measured as the fluorescence corresponding to the specific binding of the OsteoImage staining reagent to hydroxyapatite (HA) and expressed as relative fluorescence units (RFU; 492 nm excitation/520 nm emission wavelengths). Note, PMOB and 43KO-PMOB were seeded 10-fold more densely than MOBs, 43KO-MOBs, and MC3T3-E1 to attain a comparable cell density at the time of matrix mineralization analysis. All data are presented as means ± SE, N = 3; *P < 0.0001 (MOB-B vs. all other cells at week 1), +P < 0.05 (PMOB, MOB-B, and -C vs. 43KO-PMOB, 43KO-MOB-B, and -C at week 2), ‡P < 0.05 (MC3T3-E1 vs. 43KO-PMOB at week 2), **P < 0.001 (PMOB, MOB-C vs. 43KO-PMOB, 43KO-MOB-B, and -C at week 3), #P < 0.001 (MOB-B, MC3T3-E1 vs. 43KO-PMOB, 43KO-MOB-C at week 3). P values were obtained using one-way ANOVA followed by Tukey's multiple comparison test.
Fig. 8.
Fig. 8.
Impact of Cx43 deletion on expression of key osteoblastic differentiation markers. MOB and 43KO-MOB mouse osteoblastic cell lines (seeded at 1.5×10³ cells/cm2) and PMOB and 43KO-PMOB mouse osteoblasts (seeded 2.0 × 10⁴ cells/cm2) were plated in 35-mm dishes and cultured in α-MEM + 10% FBS for 6 and 9 days. Quantitative real-time PCR analysis of osteopontin (A, D), type I collagen (B, E), and osteocalcin (C, F) mRNA expression in Cx43-null cells relative to wild-type cells at 6 and 9 days after being plated. The ΔΔCT method was used for analysis, where the value obtained for each gene of interest is first normalized to that of the reference gene (β-actin) and then to MOB-C for 43KO-MOB-C, and to PMOB for 43KO-PMOB (indicated by horizontal lines). All data are presented as means ± SE, N = 3 for hTERT-immortalized cells; *P < 0.05, **P < 0.005, ***P < 0.0005. P values were obtained using t-tests.
Fig. 9.
Fig. 9.
Effect of Cx43 deletion on expression levels of Runx2 and osterix. Wild-type MOB and 43KO-MOB mouse osteoblastic cell lines (seeded at 1.5 × 10³ cells/cm2) were plated in 35-mm dishes and cultured in α-MEM + 10% FBS for 6 and 9 days. Quantitative real-time PCR analysis of Runx2 (A) and osterix (B) mRNA expression in 43KO-MOB-C relative to MOB-C at 6 and 9 days after platting. The ΔΔCT method was used for data analysis where the value obtained for each gene of interest is first normalized to the reference gene (β-actin) and then to that obtained for MOB-C (indicated by horizontal lines). All data are presented as means ± SE, N = 3; *P < 0.05, **P < 0.005, ***P < 0.0005. P values were obtained using t-tests.

Similar articles

Cited by

References

    1. Aubin JE, Turksen K, Heersche JNM. Osteoblastic cell lineage. In: Cellular and Molecular Biology of Bone, edited by Noda M. San Diego, CA: Academic, 1993, p. 1–45
    1. Baek WY, Lee MA, Jung JW, Kim SY, Akiyama H, de Crombrugghe B, Kim JE. Positive regulation of adult bone formation by osteoblast-specific transcription factor osterix. J Bone Miner Res 24: 1055–1065, 2009 - PMC - PubMed
    1. Bodnar AG, Ouellette M, Frolkis M, Holt SE, Chiu CP, Morin GB, Harley CB, Shay JW, Lichtsteiner S, Wright WE. Extension of life-span by introduction of telomerase into normal human cells. Science 279: 349–352, 1998 - PubMed
    1. Bonewald LF, Harris SE, Rosser J, Dallas MR, Dallas SL, Camacho NP, Boyan B, Boskey A. von Kossa staining alone is not sufficient to confirm that mineralization in vitro represents bone formation. Calcif Tissue Int 72: 537–547, 2003 - PubMed
    1. Chen D, Chen H, Feng JQ, Windle JJ, Koop BA, Harris MA, Bonewald LF, Boyce BF, Wonzney JM, Mundy GR, Harris SE. Osteoblastic cell line derived from a transgenic mouse containing the osteocalcin promoter driving SV40 T-antigen. Mol Cell Differ 3: 193–212, 1995

Publication types

LinkOut - more resources