Comparative Study
. 2010 Nov;20(11):1503-11.
doi: 10.1101/gr.106666.110. Epub 2010 Aug 4.

Genomic signatures of germline gene expression

Affiliations
Comparative Study

Genomic signatures of germline gene expression

Graham McVicker et al. Genome Res. 2010 Nov.

Abstract

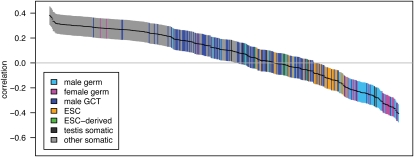
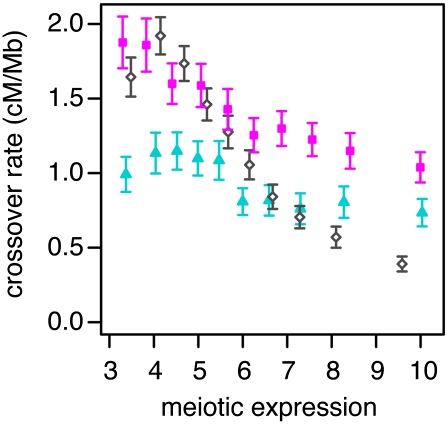
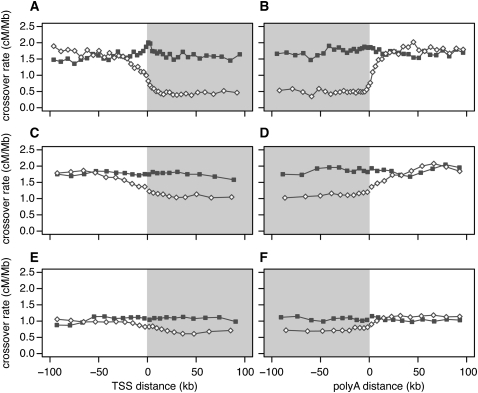
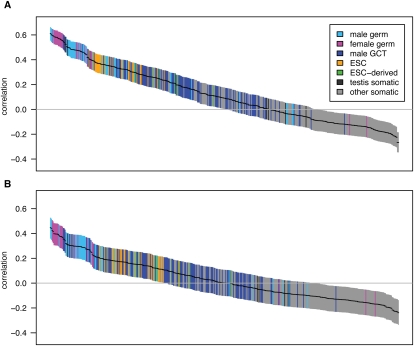
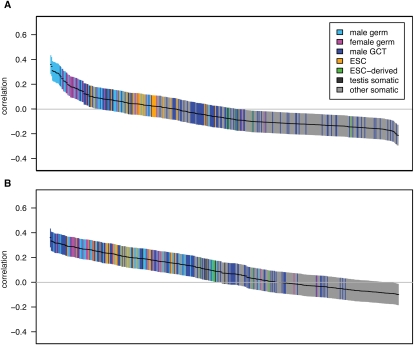
Transcribed regions in the human genome differ from adjacent intergenic regions in transposable element density, crossover rates, and asymmetric substitution and sequence composition patterns. We tested whether these differences reflect selection or are instead a byproduct of germline transcription, using publicly available gene expression data from a variety of germline and somatic tissues. Crossover rate shows a strong negative correlation with gene expression in meiotic tissues, suggesting that crossover is inhibited by transcription. Strand-biased composition (G+T content) and A → G versus T → C substitution asymmetry are both positively correlated with germline gene expression. We find no evidence for a strand bias in allele frequency data, implying that the substitution asymmetry reflects a mutation rather than a fixation bias. The density of transposable elements is positively correlated with germline expression, suggesting that such elements preferentially insert into regions that are actively transcribed. For each of the features examined, our analyses favor a nonselective explanation for the observed trends and point to the role of germline gene expression in shaping the mammalian genome.


Figures

Figure 1.
Figure 1.
Pairwise correlations between gene expression and crossover rate for a set of genes with high tissue differentiation. Each of the 409 tissue samples is represented by a single bar, colored by tissue type as defined in the key (ESC, embryonic stem cells; GCT, germ cell tumors). Bars are ordered from left to right by the correlation coefficient, r, with the vertical extent of the bar indicating the 95% confidence interval. Only the 507 genes with at least 10 kb of sequence data and the highest tissue differentiation were included in this analysis, as these genes have more tissue-specific patterns of expression and provide the most power for discriminating between tissues; for correlations with the complete gene set see Supplemental Figure S1.
Figure 2.
Figure 2.
Crossover rate as a function of gene expression. Crossover rates for each gene are estimated from male (blue triangles) and female (pink squares) pedigree-based linkage maps or a fine-scale linkage-disequilibrium map (open diamonds). Genes are binned by their meiotic expression (into 10 bins of 1239 genes each); each point gives the mean crossover rate of the genes in a bin. Meiotic expression estimates are from fetal ovaries from 12–18 wk gestation (female map), spermatocytes (male map), or an average of the two (LD-based map). Only autosomal genes of at least 10 kb in length were used in this analysis. Error bars are 95% confidence intervals.
Figure 3.
Figure 3.
Crossover rate as a function of distance from the nearest transcription start site (TSS), and the nearest polyadenylation site. To calculate distances, we used the 5′-most TSS and the 3′-most poly(A) site in genes having more than one such site. Gray shading denotes transcribed regions. (A,B) Linkage disequilibrium–based crossover rates for genes with high (open diamonds) and low (filled squares) meiotic gene expression. (C,D) Pedigree-based female crossover rates for genes with high (open diamonds) and low (filled squares) fetal ovary expression from 12 –18 wk gestation. (E,F) Pedigree-based male crossover rates for genes with high (open diamonds) and low (filled squares) spermatocyte expression.
Figure 4.
Figure 4.
Pairwise correlations between gene expression and strand-biased composition and substitution rates for high tissue differentiation genes. The figure layout is as described in Figure 1. Correlations are between gene expression and G+T content (n = 507) (A) or A → G/T → C substitution asymmetry (n = 346) (B). For correlations with the complete gene set, see Supplemental Figure S2.
Figure 5.
Figure 5.
Pairwise correlations between gene expression and transposable element density for high tissue differentiation genes. The figure layout is as described in Figure 1. Correlations are between gene expression and L1 density (A) or Alu density (B) (n = 507). For correlations with the complete gene set, see Supplemental Figure S3.

Similar articles

Cited by

References

    1. Barberi T, Willis LM, Socci ND, Studer L 2005. Derivation of multipotent mesenchymal precursors from human embryonic stem cells. PLoS Med 2: e161 doi: 10.1371/journal.pmed.0020161 - PMC - PubMed
    1. Bolstad BM, Irizarry RA, Astrand M, Speed TP 2003. A comparison of normalization methods for high density oligonucleotide array data based on variance and bias. Bioinformatics 19: 185–193 - PubMed
    1. Branciforte D, Martin SL 1994. Developmental and cell type specificity of LINE-1 expression in mouse testis: Implications for transposition. Mol Cell Biol 14: 2584–2592 - PMC - PubMed
    1. Buard J, Barthès P, Grey C, de Massy B 2009. Distinct histone modifications define initiation and repair of meiotic recombination in the mouse. EMBO J 28: 2616–2624 - PMC - PubMed
    1. Cai JJ, Macpherson JM, Sella G, Petrov DA 2009. Pervasive hitchhiking at coding and regulatory sites in humans. PLoS Genet 5: e1000336 doi: 10.1371/journal.pgen.1000336 - PMC - PubMed

Publication types

Substances

LinkOut - more resources