. 2010 Aug 4;2(43):43ra56.
doi: 10.1126/scitranslmed.3001127.

Ferroportin and iron regulation in breast cancer progression and prognosis

Affiliations

Ferroportin and iron regulation in breast cancer progression and prognosis

Zandra K Pinnix et al. Sci Transl Med. .

Erratum in

  • Sci Transl Med. 2010 Aug 25;2(46):46er1

Abstract

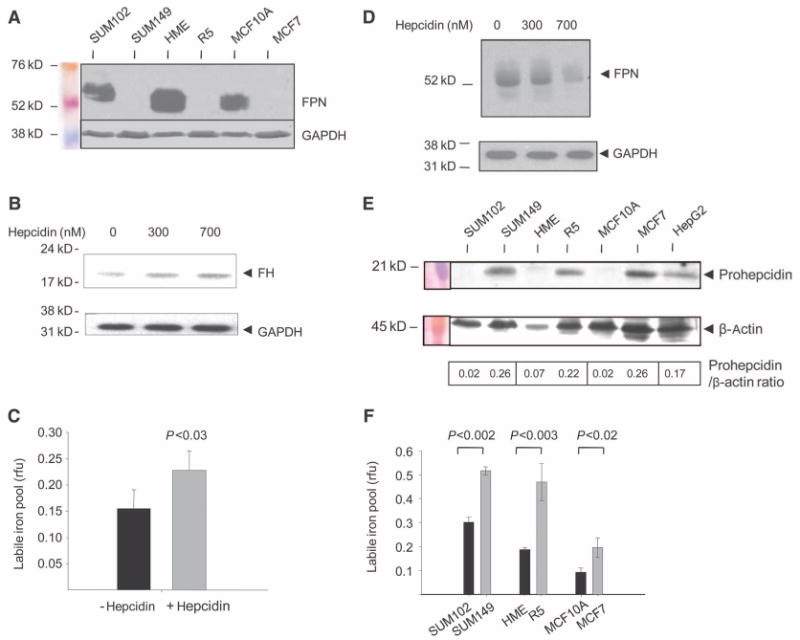
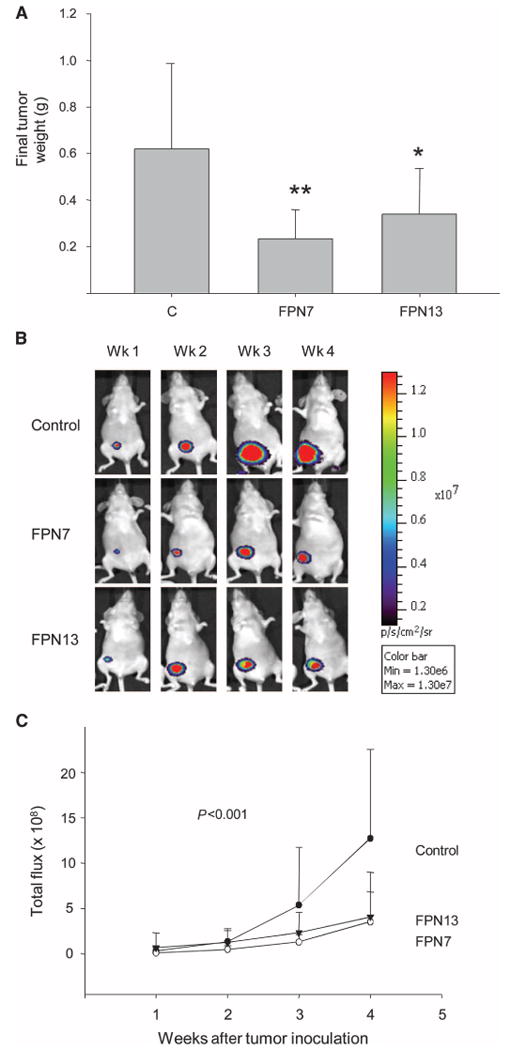
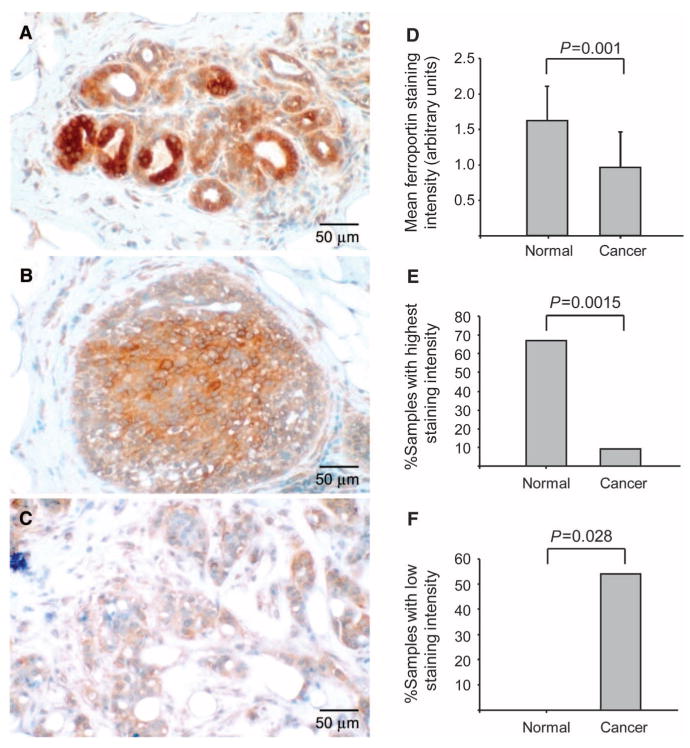
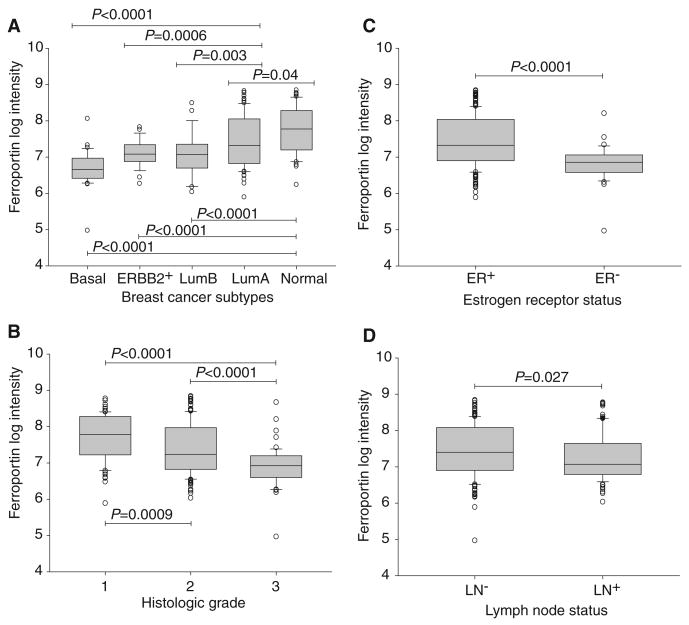
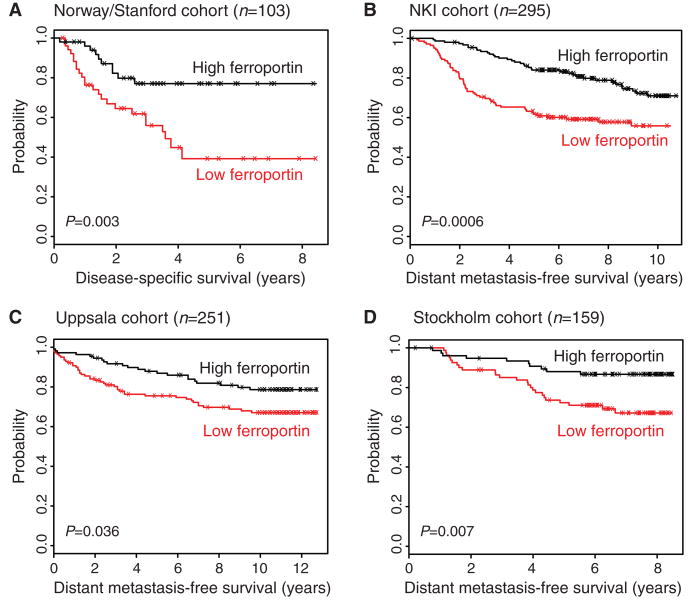
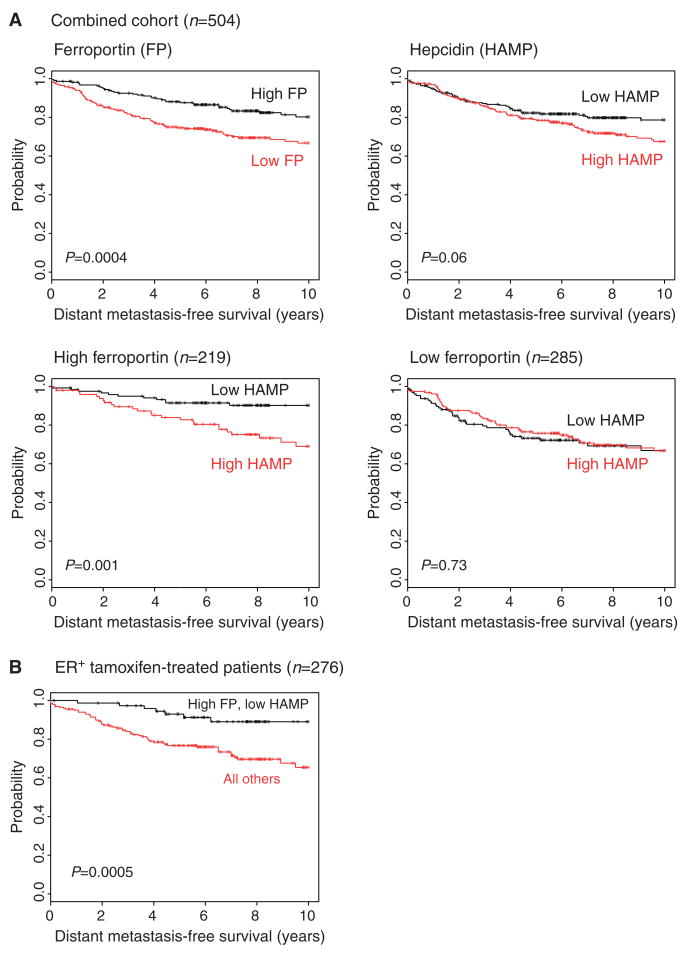
Ferroportin and hepcidin are critical proteins for the regulation of systemic iron homeostasis. Ferroportin is the only known mechanism for export of intracellular non-heme-associated iron; its stability is regulated by the hormone hepcidin. Although ferroportin profoundly affects concentrations of intracellular iron in tissues important for systemic iron absorption and trafficking, ferroportin concentrations in breast cancer and their influence on growth and prognosis have not been examined. We demonstrate here that both ferroportin and hepcidin are expressed in cultured human breast epithelial cells and that hepcidin regulates ferroportin in these cells. Further, ferroportin protein is substantially reduced in breast cancer cells compared to nonmalignant breast epithelial cells; ferroportin protein abundance correlates with metabolically available iron. Ferroportin protein is also present in normal human mammary tissue and markedly decreased in breast cancer tissue, with the highest degree of anaplasia associated with lowest ferroportin expression. Transfection of breast cancer cells with ferroportin significantly reduces their growth after orthotopic implantation in the mouse mammary fat pad. Gene expression profiles in breast cancers from >800 women reveal that decreased ferroportin gene expression is associated with a significant reduction in metastasis-free and disease-specific survival that is independent of other breast cancer risk factors. High ferroportin and low hepcidin gene expression identifies an extremely favorable cohort of breast cancer patients who have a 10-year survival of >90%. Ferroportin is a pivotal protein in breast biology and a strong and independent predictor of prognosis in breast cancer.


Figures

Fig. 1
Fig. 1
A decrease in ferroportin and increase in hepcidin are associated with an increase in the labile iron pool (LIP) in breast cancer cell lines. (A) Concentrations of ferroportin (FPN) in normal and malignant breast cells. Protein (50 μg) from each cell type was analyzed for ferroportin expression by Western blotting. Loading was assessed with an antibody to GAPDH. (B) Hepcidin treatment increases concentrations of ferritin protein in breast cells. HME cells were treated with vehicle and 300 or 700 nM hepcidin for 6 hours, and ferritin H (FH) was assessed by Western blotting. GAPDH was used as a loading control. The increase in ferritin was about twofold as measured by quantification of ferritin/GAPDH ratios by scanning densitometry. (C) Hepcidin treatment increases the LIP. HME cells were treated with 700 nM hepcidin or vehicle control, and the LIP was measured as described in Materials and Methods. rfu, relative fluorescence units. (D) Ferroportin is degraded in normal mammary epithelial (HME) cells treated with hepcidin. Cells were incubated with vehicle and 300 or 700 nM hepcidin for 6 hours, and ferroportin was measured by Western blotting. GAPDH was used as a loading control. (E) Western blot of prohepcidin protein in normal and malignant breast cells. The HepG2 hepatocellular carcinoma cell line was used as a positive control. (Prohepcidin was detected in all cells on prolonged exposure.) β-Actin was used as a loading control. The calculated ratio of prohepcidin to β-actin signal intensity is shown. (F) LIP in normal and malignant breast cells. Graphs show mean and SD of triplicate determinations.
Fig. 2
Fig. 2
Increased concentrations of ferroportin decrease growth of breast cancer xenografts. MDA-MB-231-luc breast cancer cells were transfected with an expression vector for ferroportin or control empty vector. Two independent ferroportin clones were isolated (FPN7 and FPN13). (A) Final tumor weights [n = 10, 8, and 13 for controls (C), FPN7, and FPN13, respectively]. *P = 0.013, **P = 0.029, difference from controls; Student's t test. (B) Representative bioluminescent images of individual mice within each group. (C) Quantified bioluminescence in control and ferroportin tumors. Means and SDs are plotted. P value represents test for the time by group interaction, indicating a significant difference among the three groups.
Fig. 3
Fig. 3
Ferroportin is decreased in human breast cancer tissue. (A to C) Ferroportin staining in tissue. Tissue was isolated from a patient diagnosed with invasive ductal carcinoma. Within this single tissue, normal epithelium, ductal carcinoma in situ, and invasive breast cancer cells were observed. The tissue was stained with antibody to ferroportin 1. Original magnification, ×220. (A) Normal tissue. (B) Ductal carcinoma in situ. (C) Invasive breast cancer. (D to F) Ferroportin staining of breast TMAs. Breast TMAs were stained with antibody to ferroportin, and intensity of staining was scored as described in Materials and Methods. The range of scores was 0 to 2 (low to high). (D) Mean and SD of intensity score of normal breast tissue and cancer tissue. (E) Percentage of cells with a staining intensity of 2. (F) Percentage of tissue specimens with a staining intensity of 1.
Fig. 4
Fig. 4
Ferroportin expression is correlated with clinical and molecular features of breast cancer. (A) Ferroportin expression in breast cancer molecular subtypes. Shown are box-and-whisker plots of ferroportin gene expression as a function of molecular subtype in consecutive breast cancer patients from Uppsala, Sweden (31). Shaded rectangles represent interquartile range; line in the middle of each rectangle represents median value. Lines extending from the interquartile range mark the 5th and 95th percentile values, and the individual open circles represent values that are either above the 95th percentile or below the 5th percentile for each distribution. P values are shown above bridges linking the subtypes. LumA, luminal A; LumB, luminal B; ERBB2+, ErbB2/HER2/neu-positive–like. (B) Ferroportin expression is correlated with histologic grade. Shown are box-and-whisker plots of ferroportin gene expression as a function of histologic grade (1, 2, 3) in the Uppsala cohort. P values (Student's t test) are shown above bridges linking grade categories. (C) Ferroportin expression is correlated with breast tumor ER status. Shown are box-and-whisker plots of ferroportin gene expression as a function of ER status (+, −) in the Uppsala cohort. P value (Student's t test) is shown above the bridge linking ER categories. (D) Ferroportin expression is correlated with lymph node (LN) status. Shown are box-and-whisker plots of ferroportin gene expression as a function of lymph node status (+, −) in the Uppsala cohort. P value (Student's t test) is shown above the bridge linking grade categories.
Fig. 5
Fig. 5
Ferroportin expression in primary breast tumors is prognostic of low risk of recurrence in multiple independent microarray data sets. Breast cancer patients were ranked according to ferroportin expression levels, and DSS or DMFS of patients with below-mean expression was compared to that of patients with above-mean expression. (A to D) Kaplan-Meier plots are shown for (A) the Norway/Stanford cohort (33) (included were 103 tumors with reported expression values for ferroportin; data for 19 tumors were reported as “missing” in the original data set and these were excluded from the analysis), (B) the NKI cohort (34), (C) the Uppsala cohort (35), and (D) the Stockholm cohort (31). Log-rank tests were used to compare the survival curves between groups and to generate the P values for these comparisons.
Fig. 6
Fig. 6
Ferroportin and hepcidin prognostic interactions. (A) Associations between DMFS and high or low ferroportin and hepcidin expression levels (based on mean partitioning) in a combined multi-institutional population-based cohort consisting of 504 breast cancer cases. Kaplan-Meier plots and log-rank P values are shown for (i) ferroportin expression, (ii) hepcidin expression, (iii) high ferroportin dichotomized by low versus high hepcidin, and (iv) low ferroportin dichotomized by low versus high hepcidin. (B) Prognostic value of high ferroportin and low hepcidin expression in a combined multi-institutional cohort of uniformly treated ER+ breast cancer patients. The Kaplan-Meier plot compares the combined effects of ferroportin and low or high hepcidin expression on DMFS in patients treated with tamoxifen monotherapy.

References

    1. Thelander L, Gräslund A, Thelander M. Continual presence of oxygen and iron required for mammalian ribonucleotide reduction: Possible regulation mechanism. Biochem Biophys Res Commun. 1983;110:859–865. - PubMed
    1. Buss JL, Torti FM, Torti SV. The role of iron chelation in cancer therapy. Curr Med Chem. 2003;10:1021–1034. - PubMed
    1. Cairo G, Bernuzzi F, Recalcati S. A precious metal: Iron, an essential nutrient for all cells. Genes Nutr. 2006;1:25–39. - PMC - PubMed
    1. Maffettone C, Chen G, Drozdov I, Ouzounis C, Pantopoulos K. Tumorigenic properties of iron regulatory protein 2 (IRP2) mediated by its specific 73-amino acids insert. PLoS One. 2010;5:e10163. - PMC - PubMed
    1. Chen G, Fillebeen C, Wang J, Pantopoulos K. Overexpression of iron regulatory protein 1 suppresses growth of tumor xenografts. Carcinogenesis. 2007;28:785–791. - PMC - PubMed

Publication types

MeSH terms